Support
Support is a price area where a downtrend has repeatedly stalled and turned higher, giving traders a reference zone for buy entries, stop-loss placement, and gauging selling strength.
Support is a price area where a downtrend has stopped and reversed more than once because buying pressure showed up at that price before. Traders mark it on a chart to watch for buy entries near the zone, to place a stop loss below it, or to judge whether a decline is losing strength.
Identifying a support level on the chart
- Find a low where price stopped falling and turned up.
- Check whether price came back to roughly the same price later and turned up again — two touches make a level worth marking, three or more make it more notable.
- Draw it as a small band, not a single line; price rarely reverses at the exact same pip twice.
- Look at how far price moved away after each touch — a sharper bounce means more traders likely noticed the level.
- Treat only the most recent, untested touch as "live"; a touch that already got broken through is no longer support.
Strong support vs. a level that is about to fail
A level reads as strong when it has been touched more than once, each bounce moved away with some conviction, and the candles have closed back above it rather than just wicking through. Round numbers and old swing lows add weight because more traders are likely watching the same price.
A level reads as weak or broken when price barely pauses before continuing down — that is noise, not a real test. Long wicks already piercing through the zone on earlier touches is a sign sellers are working through the buyers there. An old level that hasn't been tested in a long time is also less reliable, since the buyers who defended it before may not still be active. Once a candle closes below a support zone, it stops being support — it often turns into resistance instead.
The EURUSD example at the top of the page
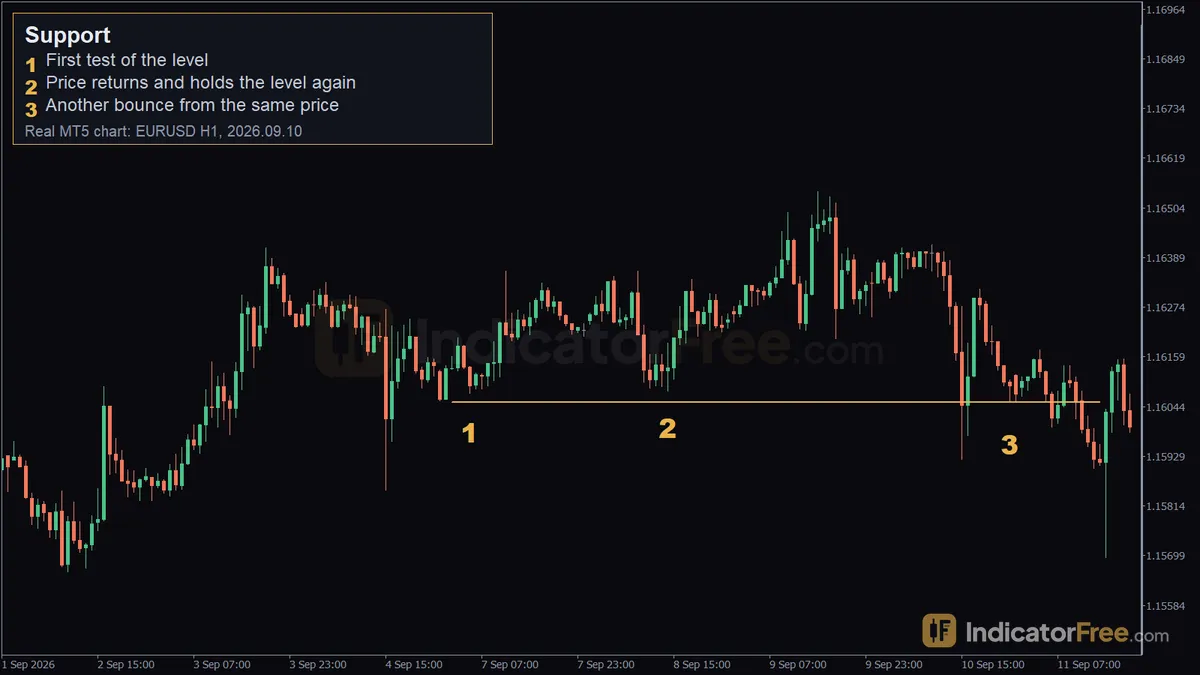
The chart at the top shows EURUSD on the H1 timeframe, where price turned up near 1.16054 three separate times between 2026.09.07 and 2026.09.10. This is a past example, not a signal for what price will do next.
Marker 1 is the first test, on 2026.09.07 at 05:00, where price turned up at 1.16075. Marker 2 shows price returning and holding the same area again on 2026.09.08 at 14:00, at 1.1608. Marker 3 is a third bounce from almost the same price, 1.16054, on 2026.09.10 at 23:00 — three touches within three days, which is what makes this zone stand out on the chart.
Practical setups built around support
//Buying the bounce (EURUSD H1)
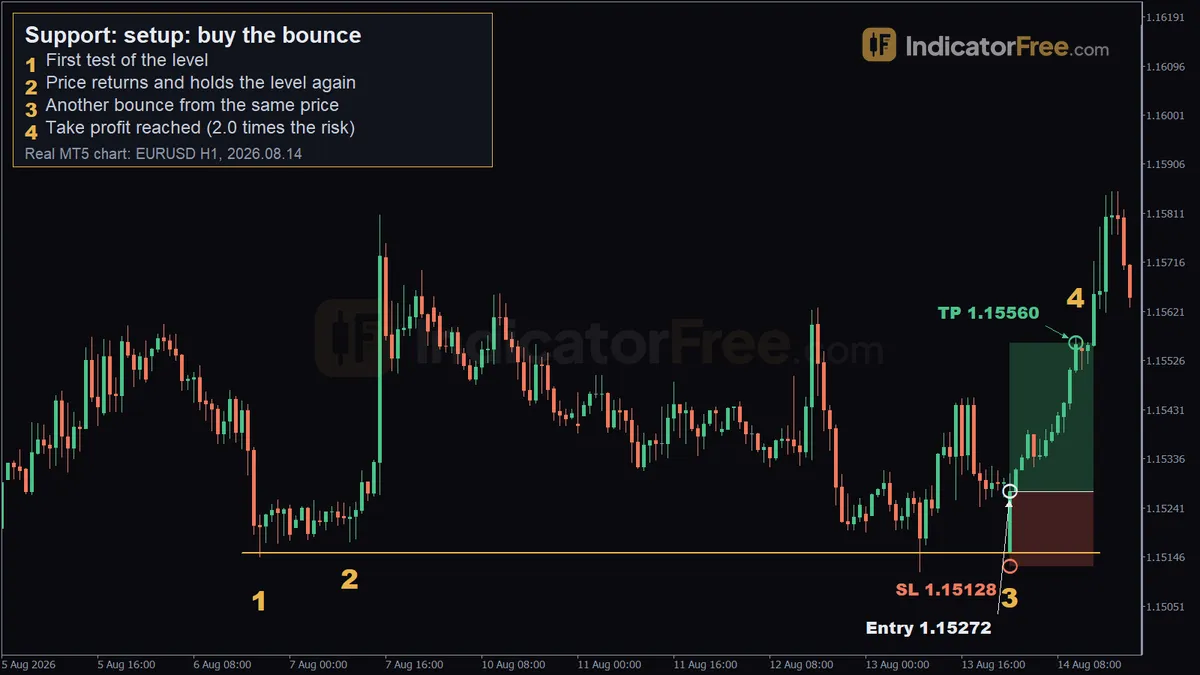
Support, setup: buy the bounce: real EURUSD H1 MT5 chart (2026-08-14).
On EURUSD H1, price turned up near 1.15154 three times between 2026.08.06 19:00 and 2026.08.14 00:00: a first test on 2026.08.06 at 19:00 (1.15147), a hold on 2026.08.07 at 10:00 (1.15176), and a third bounce on 2026.08.14 at 00:00 (1.15154). In this past example, the entry was a buy at 1.15272 on 2026.08.14 at 00:00, the stop loss sat at 1.15128 (14 pips of risk), and the take profit was 1.15560, which is 2.0 times the risk. It was reached on 2026.08.14 at 11:00.
//Break and retest (EURUSD H1)
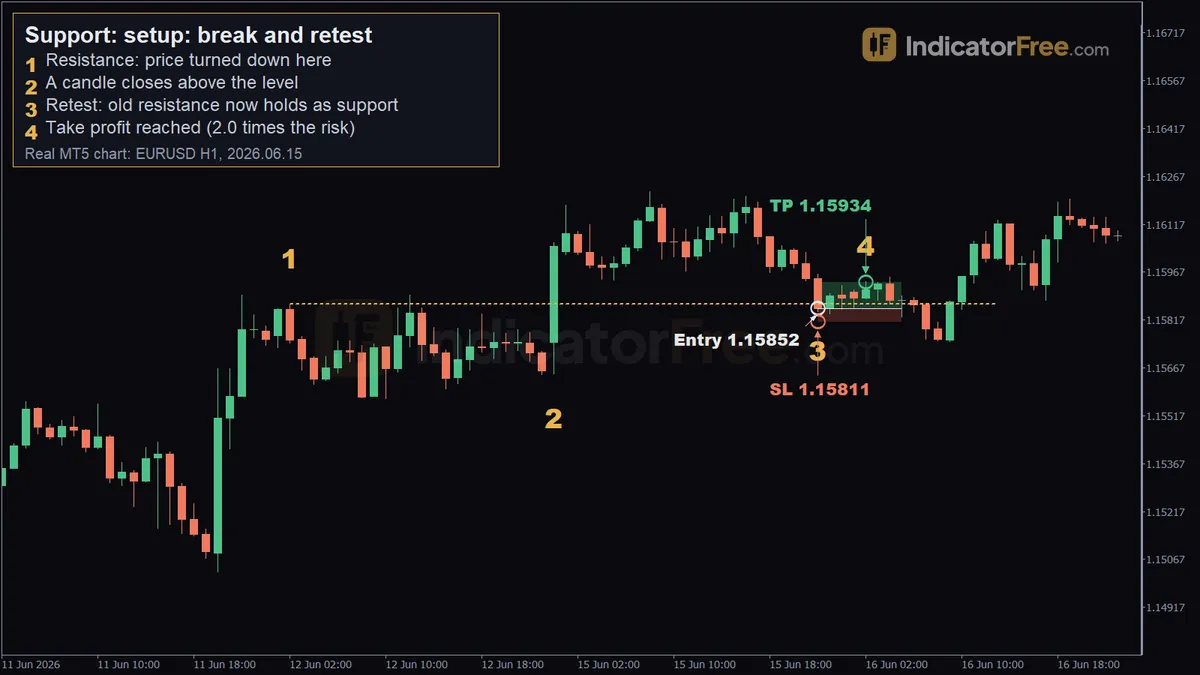
Support, setup: break and retest: real EURUSD H1 MT5 chart (2026-06-15).
This example shows the flip from resistance to support. On 2026.06.12 at 02:00, EURUSD turned down at 1.15866. A candle closed above that level on 2026.06.15 at 00:00, closing at 1.16048, and on 2026.06.15 at 22:00 price came back down to 1.15844, held, and then rose 29 pips. The entry was a buy at 1.15852 on 2026.06.15 at 22:00, the stop loss was 1.15811 (4 pips of risk), and the take profit of 1.15934 — 2.0 times the risk — was reached on 2026.06.16 at 02:00.
//Trading support on gold (XAUUSD H1)
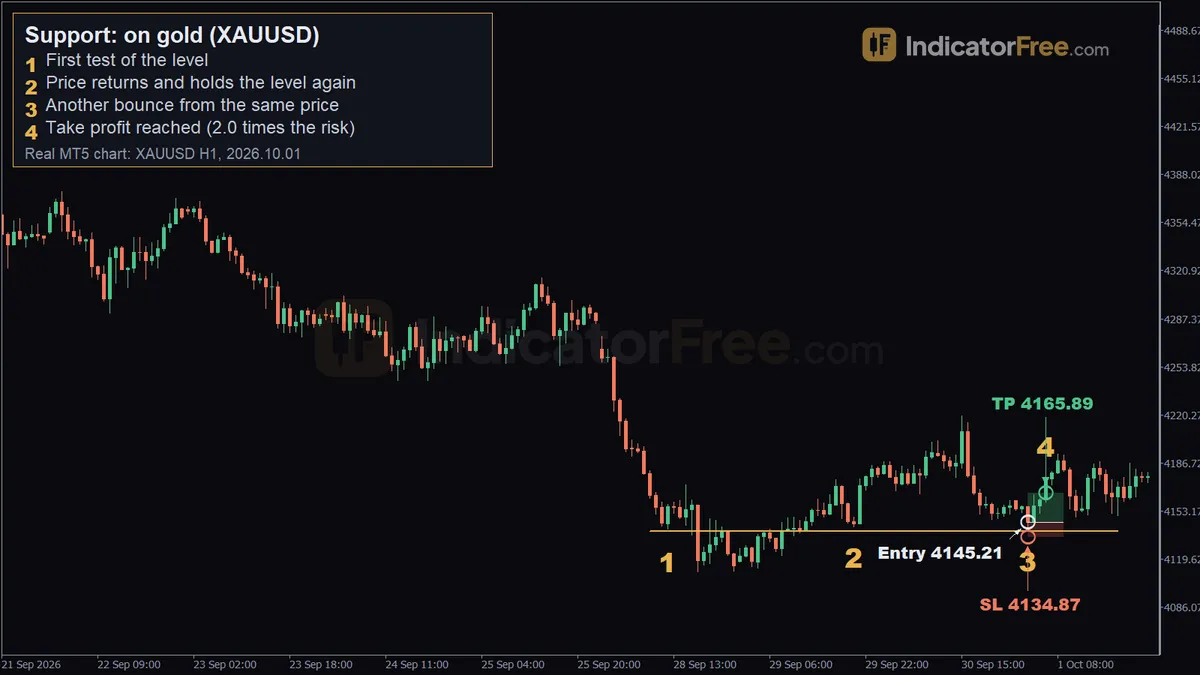
Support, on gold (XAUUSD): real XAUUSD H1 MT5 chart (2026-10-01).
Support works the same way outside forex pairs. On XAUUSD H1, price turned up near 4138.93 three times between 2026.09.28 12:00 and 2026.10.01 03:00: a first test on 2026.09.28 at 12:00 (4140.70), a hold on 2026.09.29 at 20:00 (4142.32), and a third bounce on 2026.10.01 at 03:00 (4138.93). In this past example, the entry was a buy at 4145.21 on 2026.10.01 at 03:00, the stop loss was 4134.87 (10.34 in price risk), and the take profit at 4165.89 — 2.0 times the risk — was reached on 2026.10.01 at 06:00. Note the risk here is measured in price, not pips, since gold moves in dollars per ounce.
When support setups work well, and when to avoid them
Support tends to be more useful when a market has pulled back into a zone with more than one prior touch, when the zone lines up with a round number or an obvious swing low, and when there's no major news event about to hit. It tends to fail more often during a strong, fresh downtrend making new lows, right before high-impact news, or when the zone has already absorbed several tests without a clean bounce.
| Pros | Cons |
|---|---|
| Gives a concrete price area to plan entries and stops around | A level can break without warning, especially in news |
| Works the same way on any symbol or timeframe on MT5 | Drawn by eye, so two traders may mark slightly different zones |
| A broken level often becomes a useful resistance reference later | Old, untested levels become less reliable over time |
| Combines easily with other tools like trendlines or order blocks | A single touch isn't enough evidence on its own |
Bullish support vs. the resistance side
Support is the bullish-reversal case: price has gone up from it, at least for now. The mirror image is Resistance, a price area where rallies have repeatedly stopped and turned back down — this has its own glossary entry and isn't re-explained here.
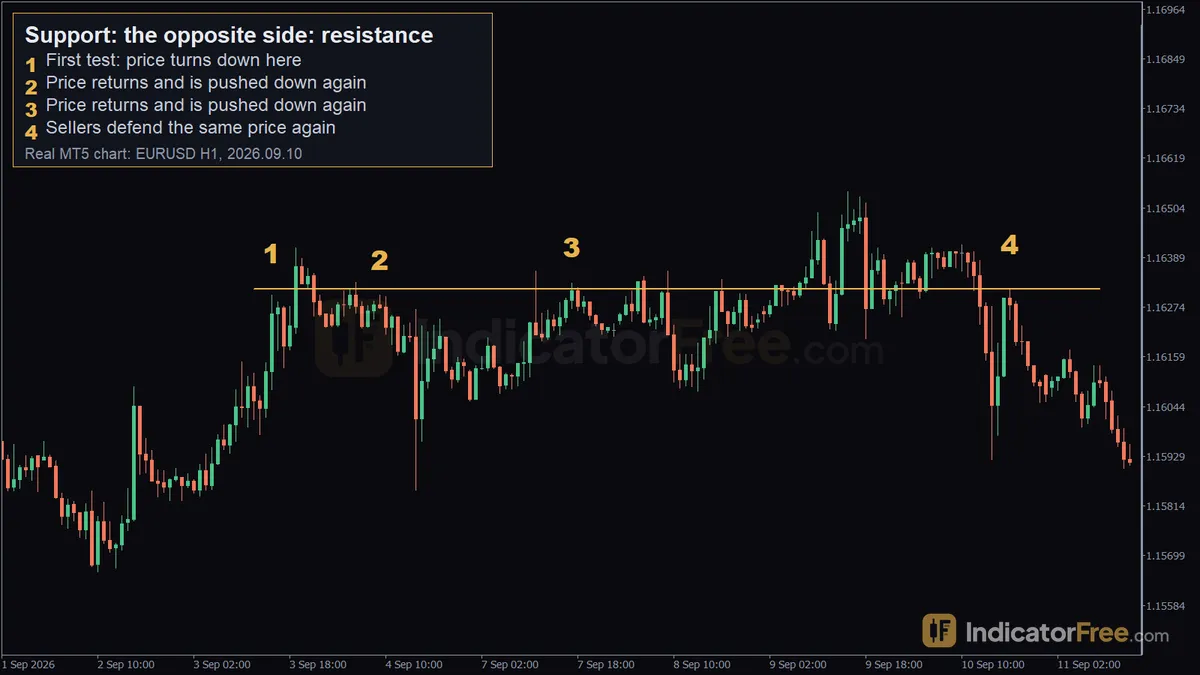
Support, the opposite side: resistance: real EURUSD H1 MT5 chart (2026-09-10).
This EURUSD H1 example shows the resistance side: price turned down near 1.16315 six times between 2026.09.03 and 2026.09.10. Four of the six touches are marked below: 2026.09.03 at 15:00 (1.16302), 2026.09.04 at 09:00 (1.16301), 2026.09.07 at 17:00 (1.16329), and 2026.09.10 at 18:00 (1.16315) — sellers defending roughly the same price each time, the opposite behavior of the support examples above.
Practical tips for trading support on MT5
- Mark the zone as a band a few pips wide, not one exact price, before deciding where orders go.
- Wait for a candle to close back above the zone rather than acting on a wick that only dips into it mid-candle.
- Place the stop loss beyond the far edge of the zone, not right at the touch price, so a normal wick doesn't take you out early.
- Remember that once a support zone is broken on a closed candle, it can act as resistance if price returns to it — the break-and-retest setup above is built on exactly that.
- On instruments like gold, think in price terms rather than pips when sizing risk, since the two aren't comparable across symbols.
- Check whether the same zone is visible on a higher timeframe too — a support area that shows up on both H1 and H4 carries more weight than one that only appears on H1 alone.
Quick checklist
- Level touched two or more times with a real bounce each time, not just a pause.
- Zone marked as a band, not a single exact price.
- Candle closed back above the zone before treating it as a buy signal.
- Stop loss sits beyond the zone, not inside it.
- The touch being used is recent, not an old level nobody has tested in a long time.
FAQ
What is support and resistance in trading? Support is a price area where a downtrend has repeatedly stopped and turned up; Resistance is the opposite case, where an uptrend has repeatedly stopped and turned down. Traders mark both to judge where price is likely to pause or reverse.
What happens when support breaks? When a candle closes below a support zone, the level stops acting as support. It often flips and starts working as resistance if price comes back up to retest it, which is the idea behind the break-and-retest setup described above.