Inside Bar Breakout
Free MT5 Inside Bar Breakout indicator: boxes the mother bar and arrows closed-bar breakouts. Lab test: 0 of 195 signals repainted on EURUSD M15.
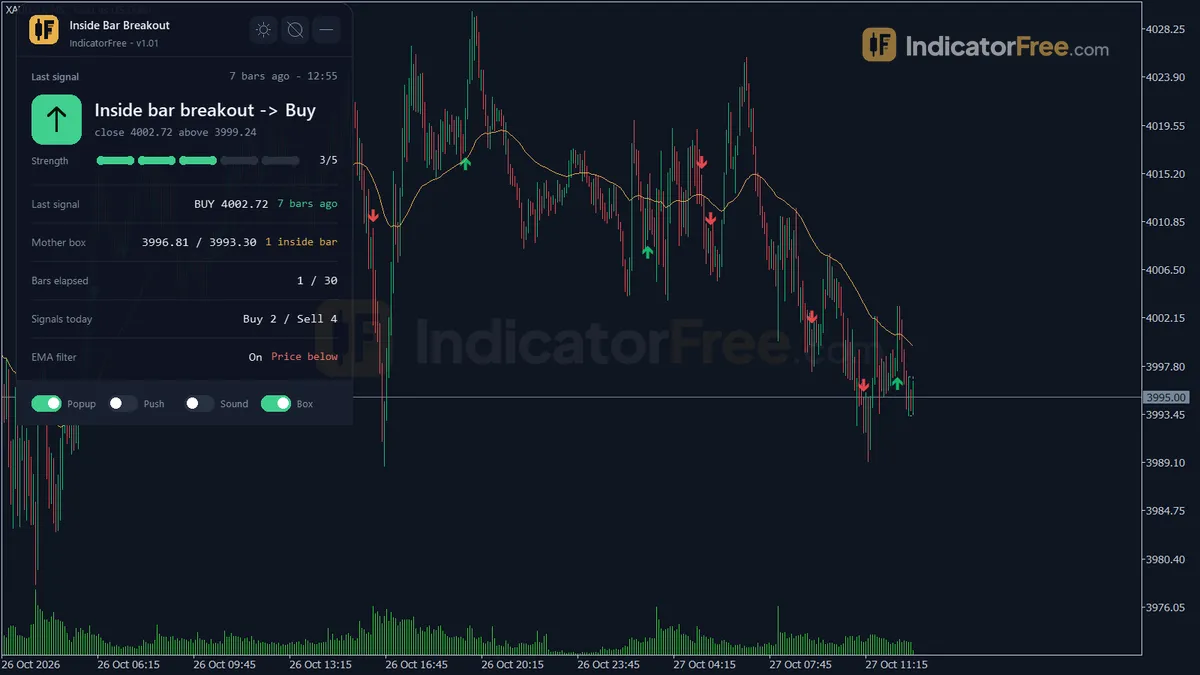
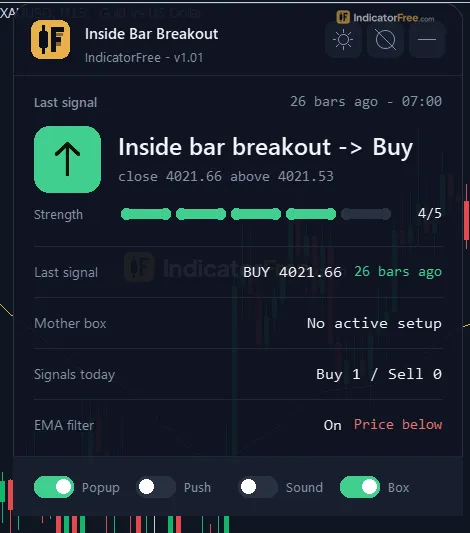
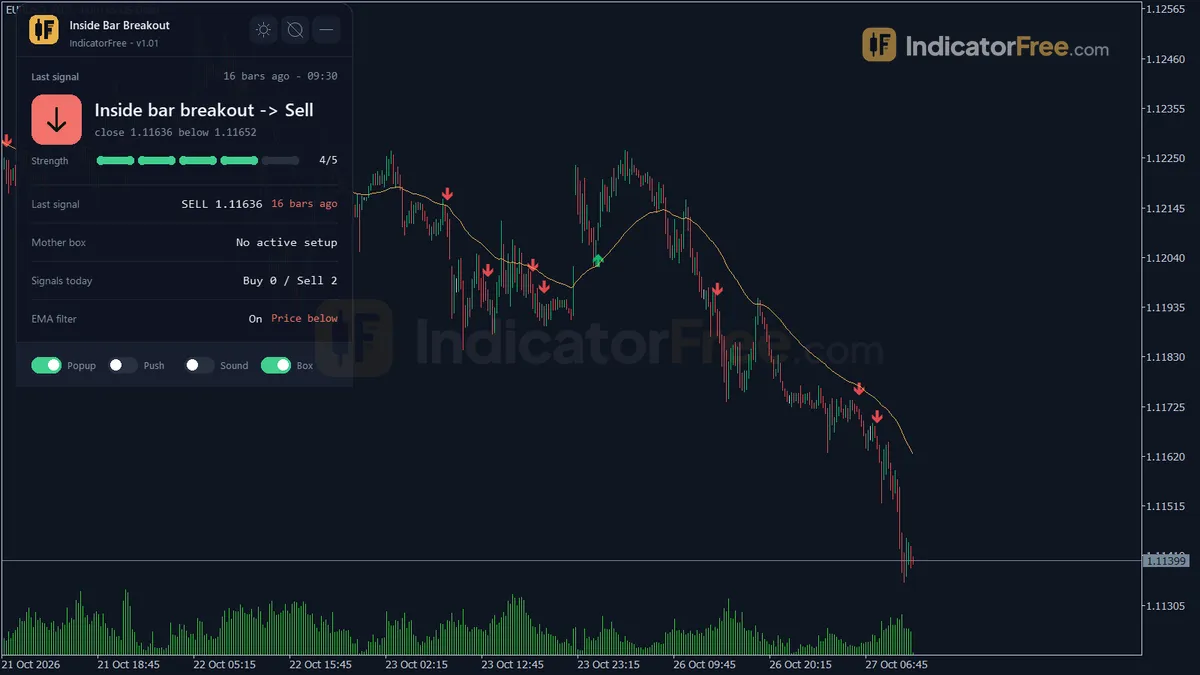
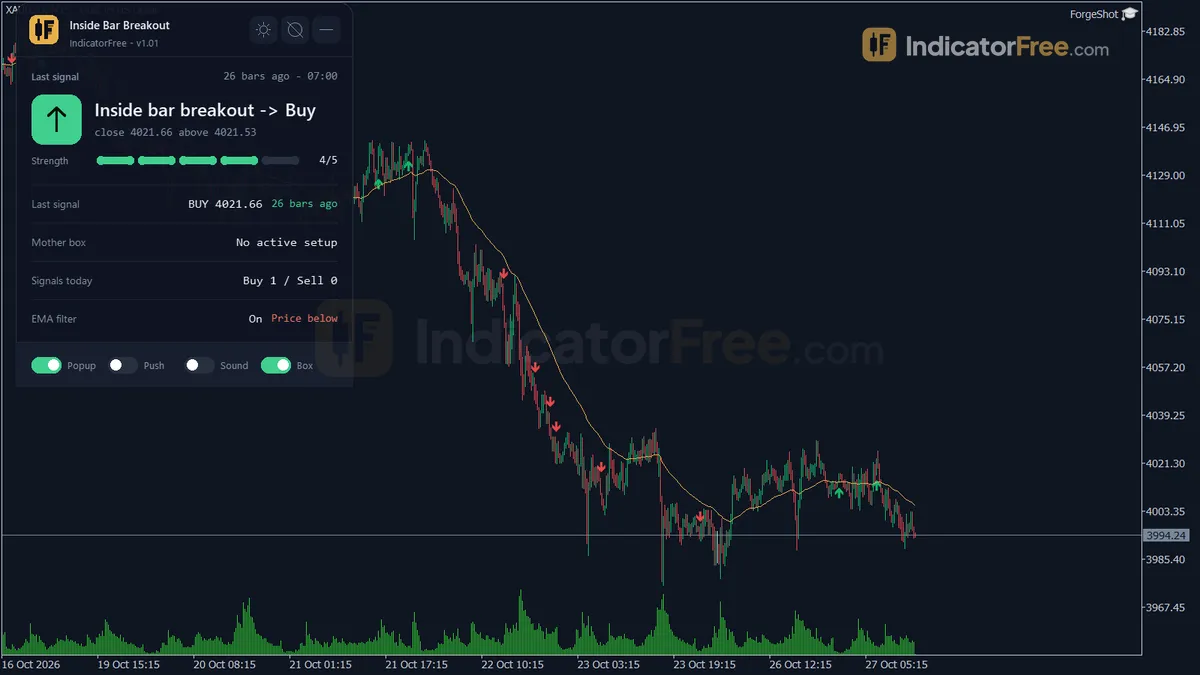
- Repainted
- 0 / 195
- Signals / week
- ≈ 14.9
- Tested on
- EURUSD M15
- Tested
- 2026-10-03
Overview
Inside Bar Breakout is a free MT5 indicator for your main price chart. It boxes a qualifying mother bar, follows the inside bars that form after it, and prints a buy or sell arrow when a closed bar breaks out of that range. In the Lab's repaint test on EURUSD M15, 0 of 195 signals changed after their bar closed.
It helps price-action traders who already trade inside bar setups and want them found, size-filtered and alerted for them, so they don't have to scan every chart by hand. An inside bar is a bar whose high and low stay within the previous bar's range. That previous bar is the mother bar.
How the Lab tested it
The Lab ran version 1.01 (125.7 KB) on MT5 build 6230. It used EURUSD M15 from 2026-07-03 to 2026-10-02 with real ticks from Raw Trading Ltd. Every arrow was logged as it appeared and then checked again after the bars closed. No arrow moved or disappeared, and the maximum arrow delay was 0 bars. So the arrow you see on the chart's history is the same arrow you would have got live, on the closing bar.
For each signal the Lab also checked which came first: a 1 ATR move in the arrow's direction or a 1 ATR move against it. The facts do not record which input values were used for this run.
What the numbers mean for you
Over the whole test, 43.1% of the 195 signals reached 1 ATR in the arrow's direction before 1 ATR against it. That is below a coin flip. On its own the arrow is a trigger, not an edge, and the trade only works if your own context and exits do the rest. The chart below splits the result by arrow type.
Scale zoomed in to show the difference (bars do not start at zero).
The outcome usually comes fast. The median signal hit one of the two 1 ATR marks within 3 bars, which is about 45 minutes on M15 (2 bars for buys, 3 for sells). Only 0.5% of signals had hit neither mark after 20 bars (1.1% of buys, 0.0% of sells). Fast resolution can go either way, so it tells you to have your stop placed before the arrow prints, not that the trade will work.
The tool fired 14.9 signals a week on one pair: 6.8 Bullish Breakouts and 8.1 Bearish Breakouts. That is about three a trading day, which is too many to take blindly.
Who it suits
It suits traders who already have a bias from a higher timeframe or from levels and want a closed-bar trigger with alerts. It does not suit you if you want arrows you can follow without your own filter. The hit rate above rules that out.
How it works
- 1An inside bar stays within the previous bar's high and low, and that previous bar becomes the mother bar.
- 2The mother bar counts only if its range is at least MinMotherRangeATR times the ATR.
Mother high - Mother low >= MinMotherRangeATR x ATR(AtrPeriod)Inputs: MinMotherRangeATR, AtrPeriod - 3A close above the mother high prints a buy arrow. A close below the mother low prints a sell arrow.
Buy: Close > Mother high. Sell: Close < Mother low - 4With the EMA filter on, buys need the close above the EMA and sells need it below.Inputs: UseEmaFilter, EmaPeriod
- 5The setup expires after MaxLookbackBreakoutBars bars, or when a bar leaves the pattern without closing outside the mother bar.Inputs: MaxLookbackBreakoutBars
Specifications
- Platform
- MetaTrader 5
- Version
- 1.01
- Type
- Indicator
- Window
- Main chart
- Draws
- 2 arrows, 1 line, 1 zone, 1 panel
- Alerts
- popup, push, sound
- Repaints
- No (0 of 195 signals changed)
- Inputs
- 13
- Tested on
- MT5 build 6230 · 2026-10-03
Repaint test
No repaint detected. In a 3 Jul 2026 – 2 Oct 2026 test on EURUSD M15 (Raw Trading Ltd real ticks), 195 signals were logged at bar close and re-read at the end of the test: 0 changed. Arrows print on the bar that closes the signal, with no delay.
IndicatorFree — tested 2026-10-03 · MT5 build 6230 · Raw Trading Ltd real ticks. Results come from historical data, not live trading, and do not guarantee future results.
Signal statistics
Over 3 Jul 2026 – 2 Oct 2026 on EURUSD M15, the indicator printed 195 arrows. After 43.1% of them, price moved 1×ATR(14) in the arrow's direction before moving 1×ATR against it (median 3 bars). 0.5% reached neither level within 20 bars.
This measures price movement after the arrow, not a trading result. It includes no spread, commission, stop loss or position sizing.
What it draws
- Arrows (Bullish Breakout) from buffer 0, drawn on the closed bar.
- Arrows (Bearish Breakout) from buffer 1, drawn on the closed bar.
- A line (Trend EMA) from buffer 2.
- Rectangles (Mother Box) drawn as chart objects, not buffers — they are not readable by iCustom() in an EA.
- An on-chart panel (Signal Board); values shown in the panel are not exposed as buffers.
Inputs
| Input | Default | What it does |
|---|---|---|
| UseEmaFilter | true | Accept only breakouts in the EMA trend direction |
| EmaPeriod | 50 | EMA period of the trend filter (on Close) |
| MinMotherRangeATR | 0.5 | Minimum mother bar range as a multiple of ATR |
| AtrPeriod | 14 | ATR period for the mother bar size filter |
| MaxLookbackBreakoutBars | 30 | Max bars to wait for a breakout before the setup expires (0 = no limit) |
| ShowMotherBarBox | true | Draw a box around the pending mother bar range |
| ArrowOffsetPoints | 20 | Distance in points between the arrow and the bar high/low |
| EnablePopupAlert | true | Popup alert on a new signal |
| EnablePushAlert | false | Push notification on a new signal |
| EnableSoundAlert | false | Play a sound on a new signal |
| Theme | Dark | Chart color theme applied on load |
| RestoreTheme | true | Restore the original chart colors on removal |
| PanelScale | 1 | Panel size multiplier (DPI is handled automatically) |
How to read it
Reading the chart: box, arrows and EMA
The Mother Box is a rectangle around the high and low of a pending mother bar. It is drawn only when that bar's range is at least MinMotherRangeATR × ATR(AtrPeriod). It stays on the chart while each new bar sits inside the previous bar. It is removed when the setup ends in one of three ways: a bar closes beyond the mother range, a bar is not inside the previous bar, or the setup is older than MaxLookbackBreakoutBars bars.
A Bullish Breakout arrow means a closed bar closed above the mother high. A Bearish Breakout arrow means a closed bar closed below the mother low. ArrowOffsetPoints sets the gap between the arrow and the bar's high or low.
The Trend EMA line is the filter. With UseEmaFilter on, only bullish breakouts that close above the EMA are accepted, and only bearish breakouts that close below it.
The illustration below shows one complete setup: a large mother bar, three inside bars that get narrower, then a close above the box with price above the EMA.
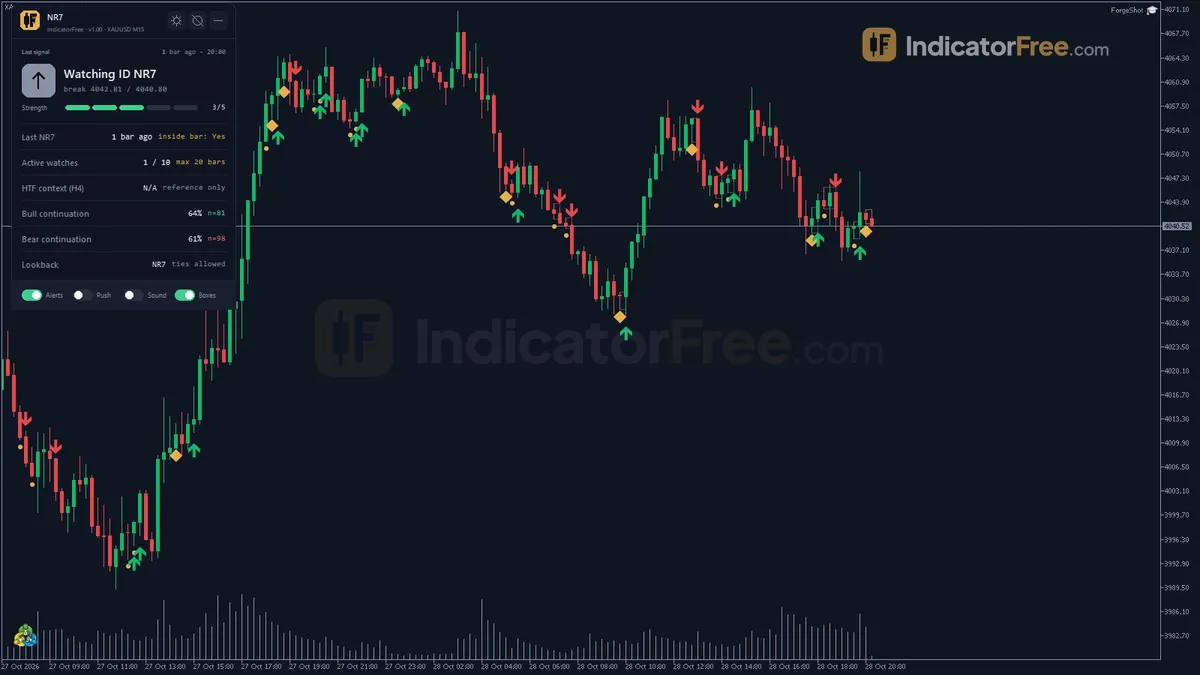
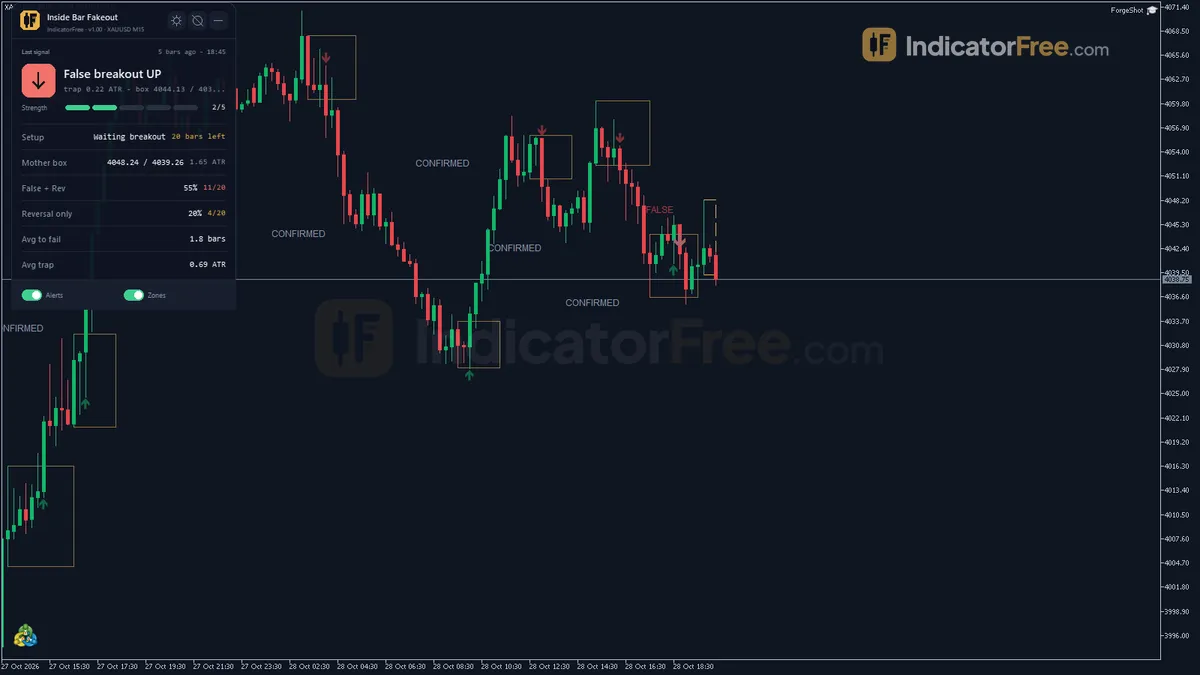
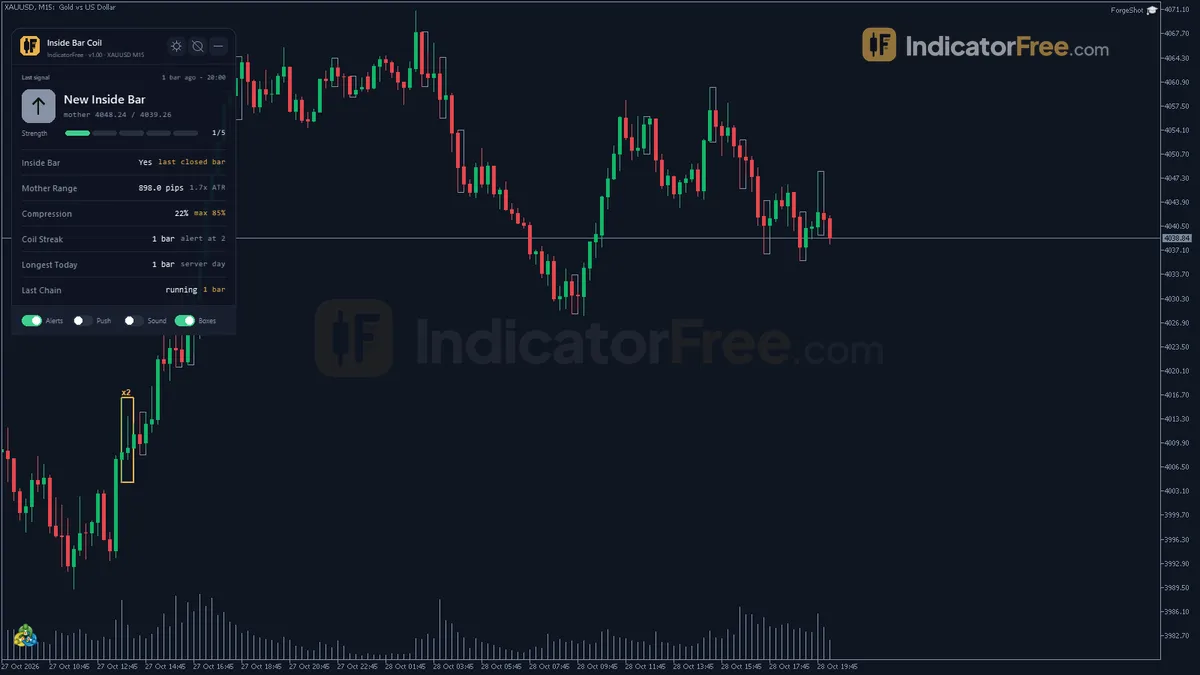
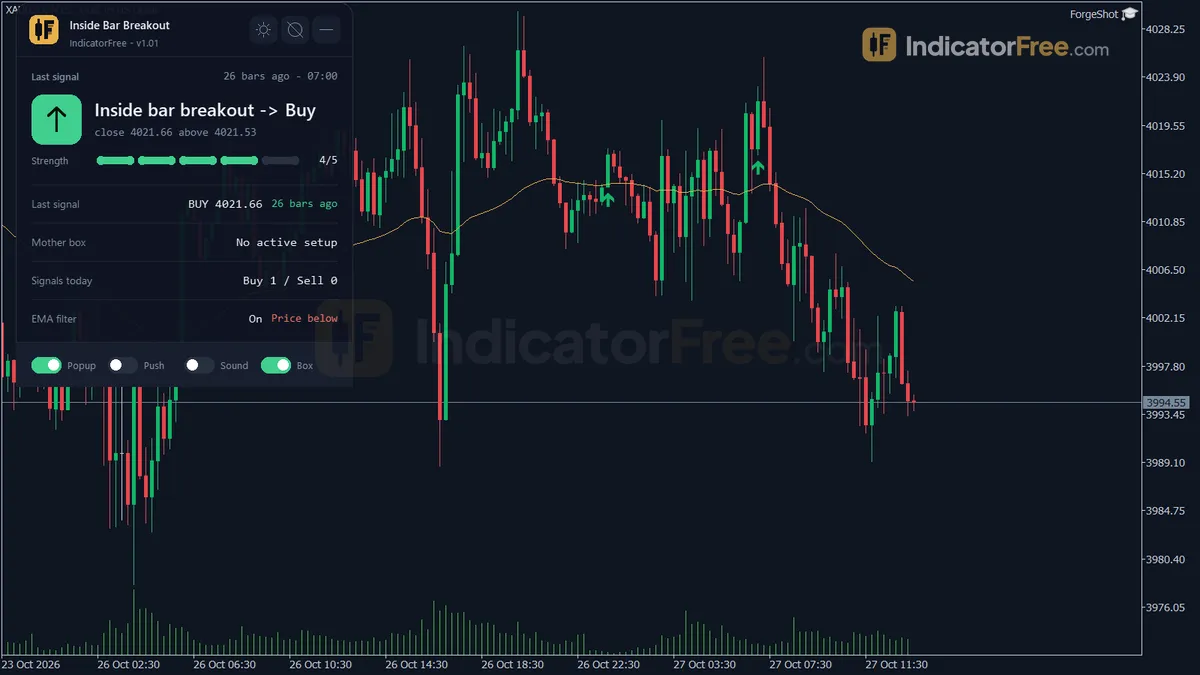
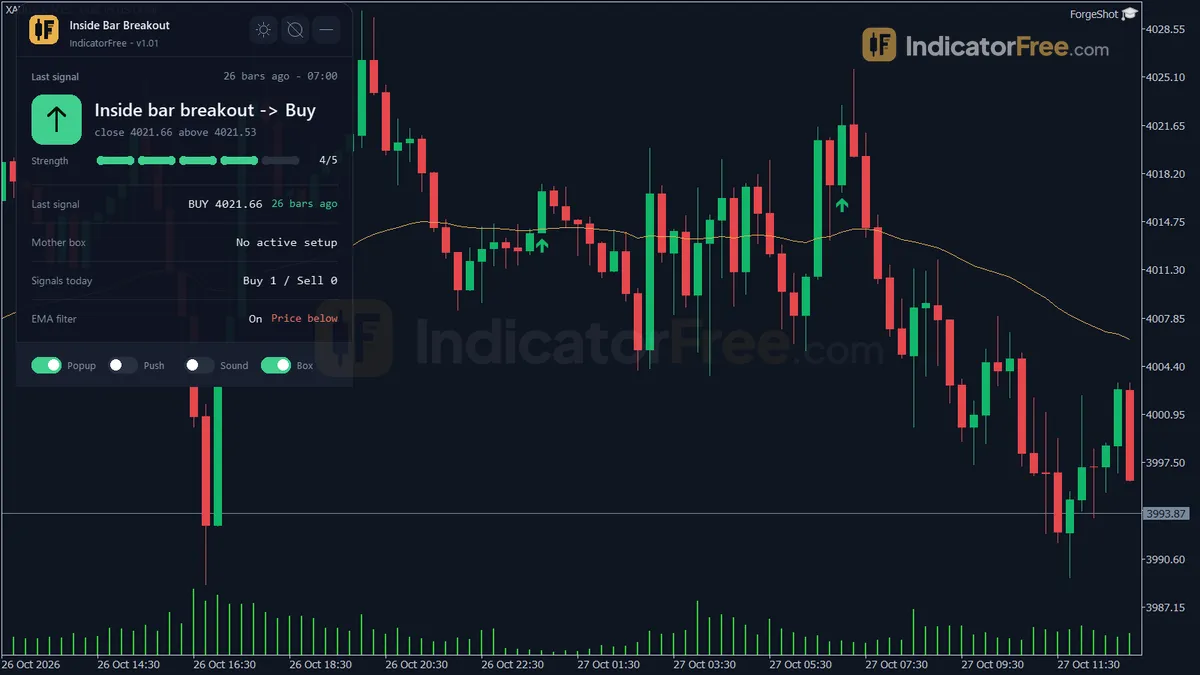
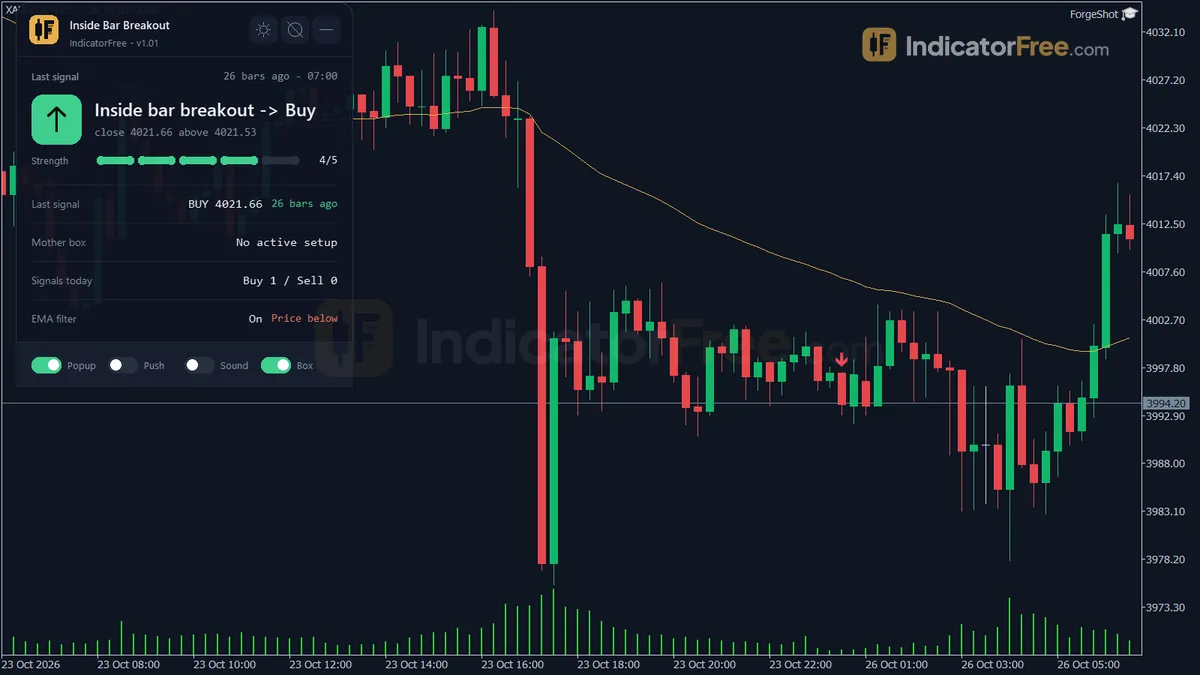
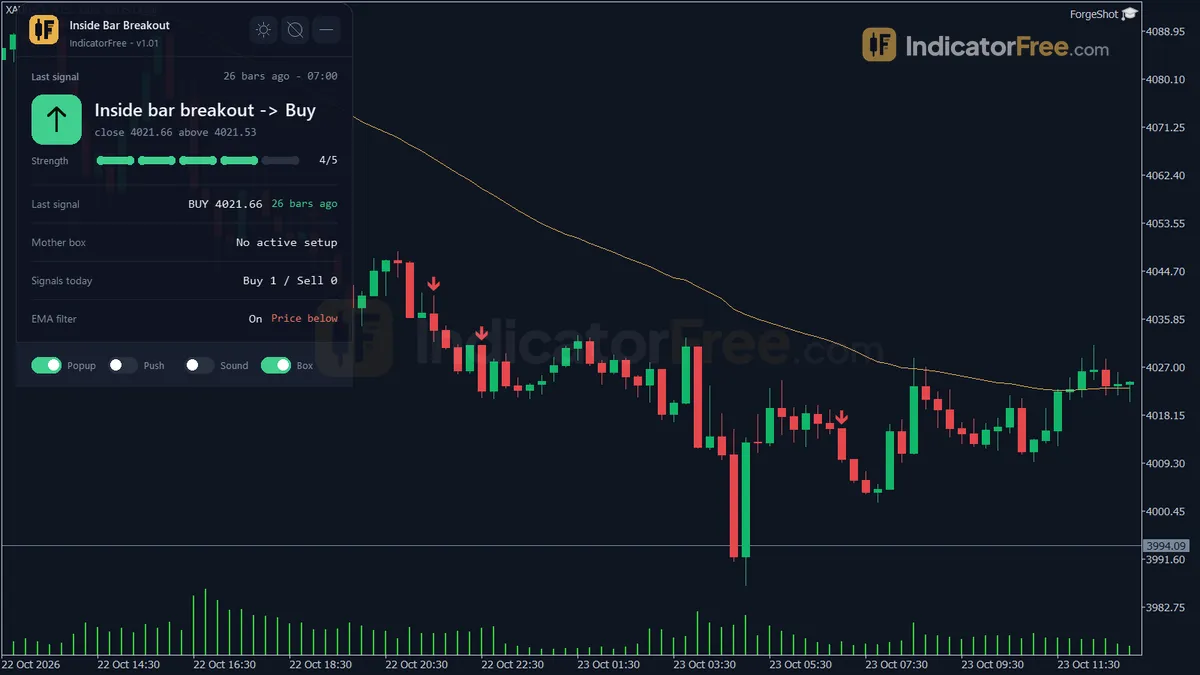
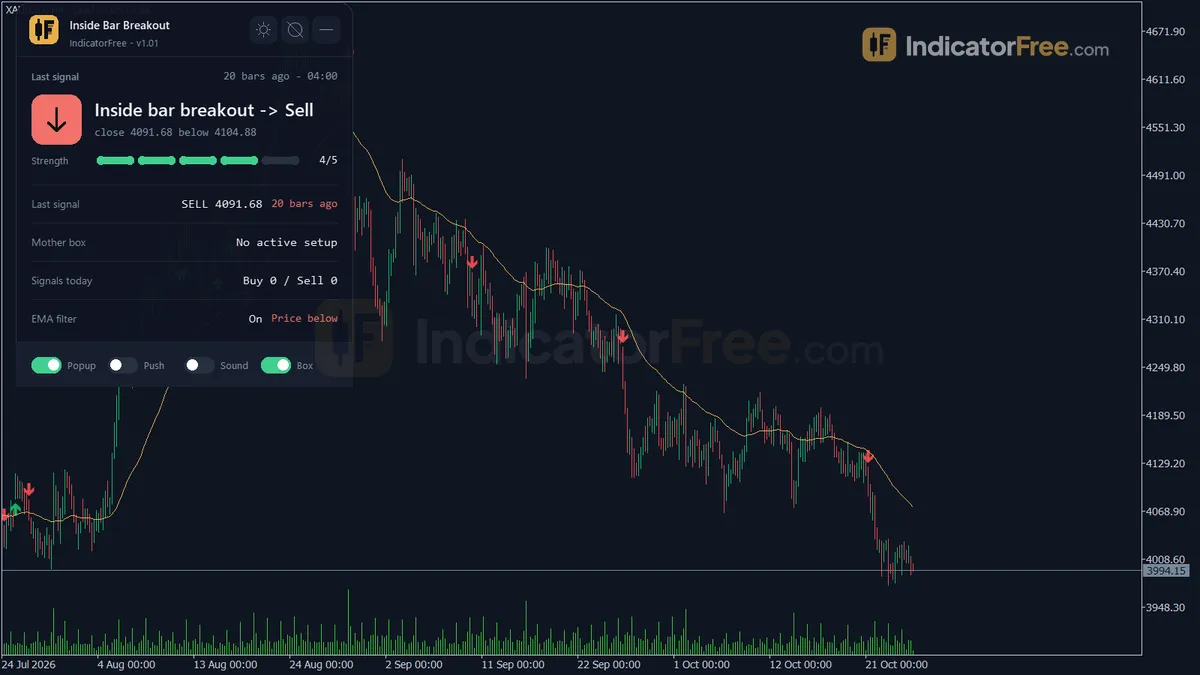
The real thing is in the Lab screenshots. Full chart with the tool attached and Same tool on EURUSD show the whole layout. Close-up of the tool's own signal or zone, Close-up: another occurrence and Close-up: an earlier occurrence show single setups. Same tool on the H4 timeframe and Same tool on the M5 timeframe show it on other timeframes, and Zoomed out: several weeks of history shows how often boxes and arrows appear.
The common misread
A wick that pokes through the box is not a breakout. The arrow needs a close beyond the mother high or low. Also watch for a box that vanishes with no arrow. That only means a bar left the pattern or the setup expired, so there is no signal in either direction. Don't trade the disappearance.
The Signal Board panel
The Signal Board shows:
- the last breakout signal
- the pending mother bar's high and low, and the inside bar count
- the bars elapsed
- the signals today
- whether the EMA filter is on
The screenshot The on-chart panel, close up shows it at full size. Use PanelScale if it is too big or too small on your screen (DPI is handled automatically).
Inputs to change first
MinMotherRangeATR(default 0.5): the main quality dial. Raise it and only larger mother bars count, so you get fewer setups. Lower it and small, noisy mother bars start to qualify.MaxLookbackBreakoutBars(default 30, 0 = no limit): how long a setup may wait for its breakout. A shorter wait drops old, stale ranges, and 0 lets a box wait forever.UseEmaFilter(default true) andEmaPeriod(default 50, on Close): with the filter off you get breakouts in both directions against the trend. A shorter period flips the allowed direction more often.AtrPeriod(default 14): the ATR used for the mother bar size check.
Any change from the defaults is your own experiment, because the Lab has not measured other values. Run it beside a default copy on the same chart and compare.
ShowMotherBarBox, ArrowOffsetPoints, Theme (default Dark), RestoreTheme and PanelScale change only how the chart looks.
Alerts
Each new signal can trigger three alerts:
EnablePopupAlert(on by default): opens the MT5 alert window.EnablePushAlert(off by default): sends a notification to the MT5 mobile app linked to your terminal.EnableSoundAlert(off by default): plays a sound.
A decision rule for each arrow
Take a Bullish Breakout only if all three are true:
- The EMA filter is on (the Signal Board shows its state).
- Your higher-timeframe bias is also up.
- A stop below the mother low fits your risk.
Take a Bearish Breakout the same way, mirrored: EMA filter on, bias down, and a stop above the mother high that fits your risk. Skip any arrow where the mother range is so wide that this stop is bigger than you would accept.
Install
Copy the .ex5 file into MQL5/Indicators, refresh the Navigator and drag the indicator onto a chart.
Installation
- 1Download InsideBarBreakoutArrows.ex5 from the button above (Google Drive).
- 2In MetaTrader 5: File → Open Data Folder → MQL5 → Indicators. Copy InsideBarBreakoutArrows.ex5 there.
- 3Restart MT5 or right-click Indicators in Navigator → Refresh.
- 4Drag Inside Bar Breakout onto a chart. For push alerts, enable "Allow push notifications" under Tools → Options → Notifications.
- Tested on MT5 build 6230.
Key terms and guides
- Moving average
- A moving average is a line drawn from the average closing price of a set number of recent candles, recalculated on every new candle. It smooths out price noise and shows which way the trend is pointing.
- Simple moving average
- A simple moving average (SMA) is the average closing price of the last n candles, drawn as one line on the chart. Traders use it to read trend direction, time pullback entries and build crossover signals.
- Exponential moving average
- The exponential moving average (EMA) is a moving average that gives the newest closes the most weight, so it turns sooner than a simple moving average. Traders use it to read trend direction and to time entries on pullbacks.
- Death cross
- A death cross is when a shorter moving average crosses below a longer one on a price chart, most often the 50-period below the 200-period. It confirms that momentum has already turned down.
- Trend channel
- A trend channel is two parallel lines drawn along a market's swing lows and swing highs. It marks the sloped zone that price has stayed inside during an uptrend or a downtrend.
- Average True Range
- Average True Range (ATR) is a volatility indicator that shows how far price typically moves per candle, gaps included, averaged over a set number of candles. It measures the size of moves, not their direction.
- Guide: How Long Does It Take to Learn Forex Trading? A Realistic Timeline
- Guide: How to Learn Crypto Trading Strategies: A Step-by-Step Beginner Plan
- Guide: Stock Market Trading Strategy for Beginners: Simple Rules You Can Follow
More on this subject: Price action & SMC guide, terms and tools
User reviews
No reviews yet. Members who download the tool can review it here.
Sign in and download the tool to review it.
Build a checklist with it
Inside Bar Breakout does one job on the chart: entry signal. Put it on the same chart as the tools below and the IndicatorFree panels merge into one checklist card, ordered trend, zone, signal, risk.
- Trend / contextHigh Volatility RegimeInside Bar Breakout tells you when; this tells you which way the market leans, so you can skip signals against it.
- Zone / levelFibonacci RetracementShows the zones and levels, so you can see whether a signal from Inside Bar Breakout fires at a level worth trading.
The Lab has not tested these combinations. Each tool is tested on its own; the card only lines up what each one says. Free members get 2 new tools a day. If one has to wait until tomorrow, install BlackBox to raise the limit to 5 a day (20 on a live account).
FAQ
Does Inside Bar Breakout repaint?
No repaint detected. In a 3 Jul 2026 – 2 Oct 2026 test on EURUSD M15 (Raw Trading Ltd real ticks), 195 signals were logged at bar close and re-read at the end of the test: 0 changed. Arrows print on the bar that closes the signal, with no delay.
Can I use Inside Bar Breakout in an EA?
Yes. Read buffer 0 (Bullish Breakout) with iCustom() on bar 1 — the last closed bar.
Why can’t my EA read the zones?
Zones and the panel are chart objects, not indicator buffers, so iCustom() does not return them.
How do I get alerts on my phone?
Enter your MetaQuotes ID under Tools → Options → Notifications, tick "Enable push notifications", and keep the push alert input on.
Does it work on other pairs?
Tested on EURUSD only; other symbols not tested.
Why did the Mother Box disappear without an arrow?
The setup ended without a breakout close. Either a bar was not inside the previous bar, or the setup was older than MaxLookbackBreakoutBars bars. That is not a signal in either direction.
How do I get the alerts on my phone?
Set EnablePushAlert to true. MT5 then sends the notification to the mobile app linked to your terminal. Only the popup alert is on by default, and sound is off.
Can I see breakouts against the trend too?
Yes. Set UseEmaFilter to false and both arrow types print whatever side of the EMA price is on. Expect more arrows, and keep in mind the Lab has not measured that setup.
Which pairs and timeframes was it tested on?
The Lab's repaint and signal statistics cover EURUSD M15 only. It runs on any symbol and timeframe, but results on other markets are not measured.
Will it change my chart colors?
It applies the Theme you pick on load (Dark by default). With RestoreTheme on, your original colors come back when you remove the indicator.
Changelog
- 1.01Rebuilt from scratch: new IFKit dashboard, new chart theme engine (None/Dark/Midnight/Light with auto-restore), and reworked panel layout (last signal card with strength meter, pending mother box, bars elapsed, signals. · 2026-10-03
Final verdict
Our verdict: a clean trigger, not a strategy
The repaint result is the main strength. Arrows appear on the closing bar and stay where they are, so your backtest by eye matches what you get live. The ATR size filter and the setup expiry also keep the chart free of tiny or stale ranges.
The weakness is just as clear. Fewer than half of the signals reached 1 ATR in their direction first, so the arrow cannot carry a trade by itself. Also note what the tool does not know:
- It has no idea where support, resistance or swing levels are.
- Its only sense of trend is one EMA.
- The Lab measured EURUSD M15 only. Gold, indices and other timeframes are not measured, even though the screenshots show it running on H4 and M5.
- –You already have a direction from a higher timeframe or a level
- –You want a closed-bar trigger with popup or push alerts
- –You manage every trade with a stop beyond the opposite mother edge
- –You want arrows you can follow with no filter of your own
- –You can't handle about three setups a day on one pair
- –You trade a market or timeframe and expect the EURUSD M15 results to carry over
Settings to start with
Start with the defaults and leave UseEmaFilter on. If you get too many setups, raise MinMotherRangeATR before you touch anything else. If arrows keep firing from ranges that formed hours ago, shorten MaxLookbackBreakoutBars. Test both changes against a default copy, because the Lab has not measured them.
A pairing idea
Inside Bar Breakout ignores swing levels. Liquidity Sweep marks BSL/SSL swing levels and arrows each sweep, so the two together let you see whether a breakout arrow fires right next to one of those levels. It is an idea to try, and the Lab has not tested the pair.