High Volatility Regime
Free MT5 indicator that flags High and Normal volatility regimes from the ATR% percentile rank. Lab repaint test: 0 of 170 signals changed.
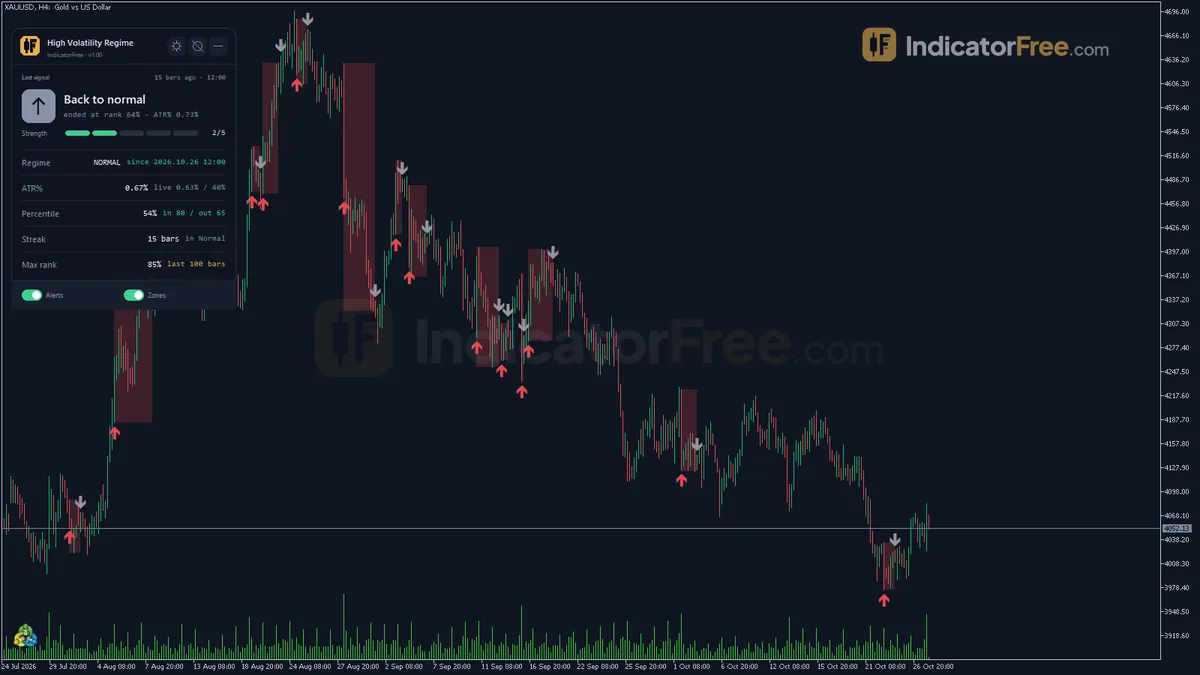
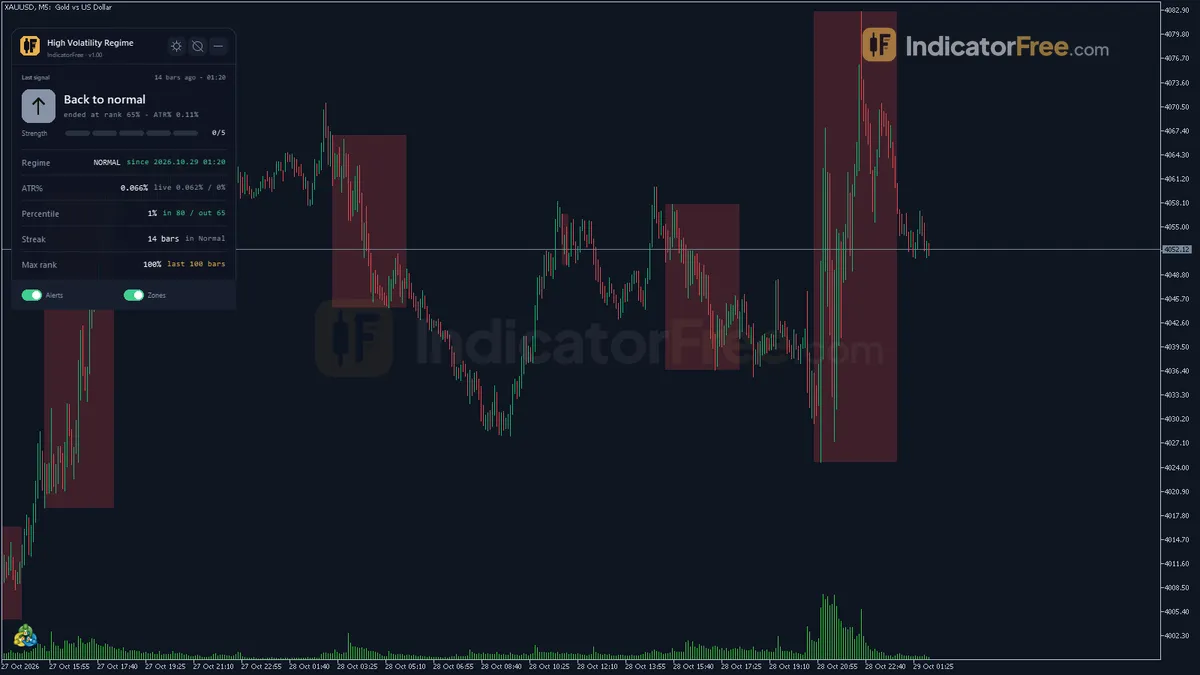
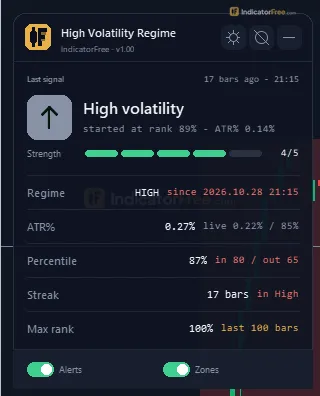
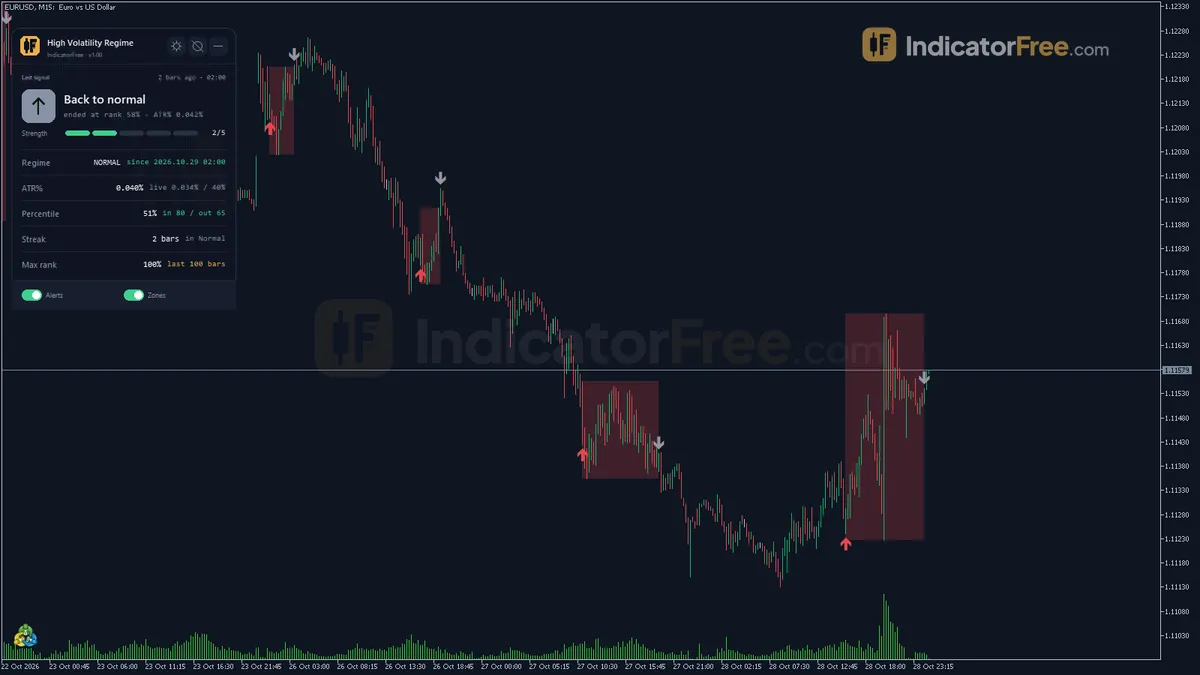
- Repainted
- 0 / 170
- Signals / week
- ≈ 13.4
- Tested on
- EURUSD M15
- Tested
- 2026-10-05
Overview
High Volatility Regime is a free MT5 indicator that labels every closed bar as High or Normal volatility. On the main price chart it draws Start and End arrows, a shaded box over each High segment and a status panel. In the Lab's repaint test on EURUSD M15 real ticks, 0 of 170 arrows changed after their bar closed.
It helps you see, at a glance, when the market has moved into an unusually active phase and when that phase is over. Use it to decide how to trade, not which way.
What it draws on your chart
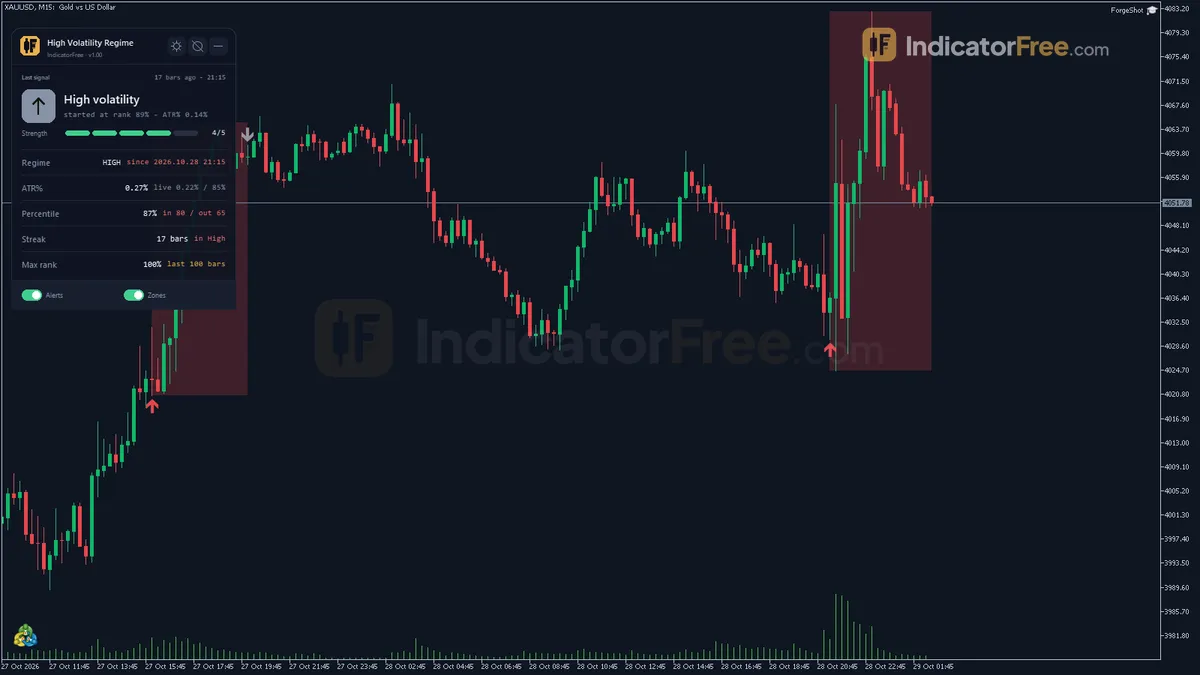
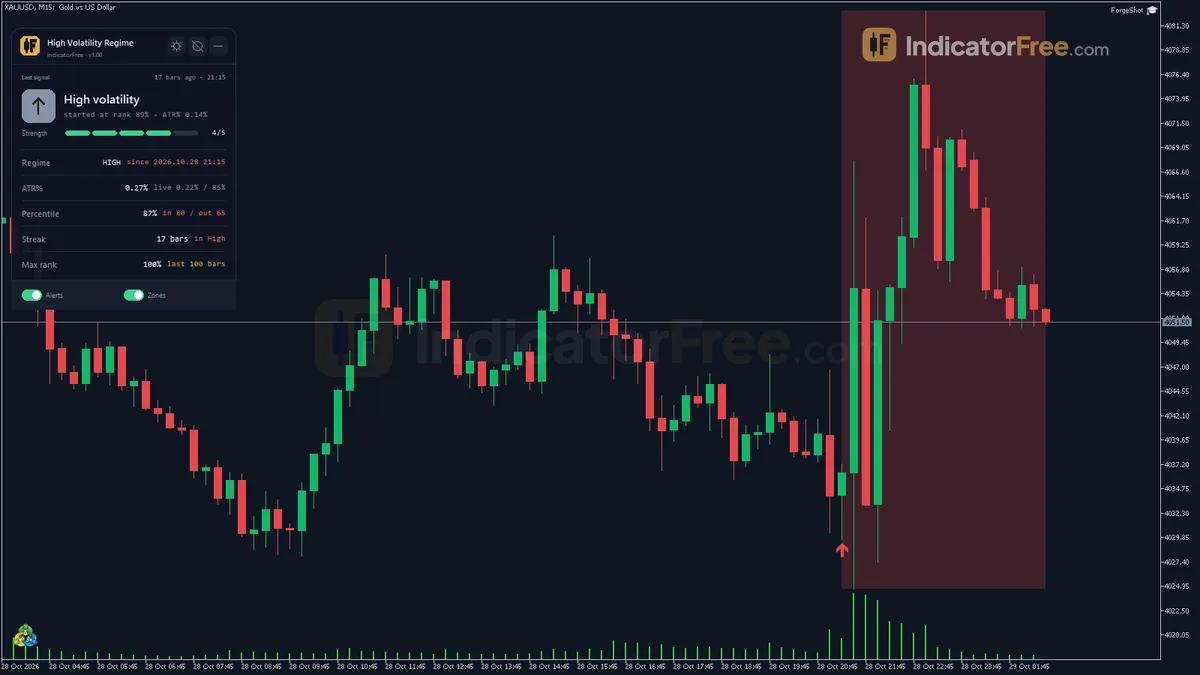
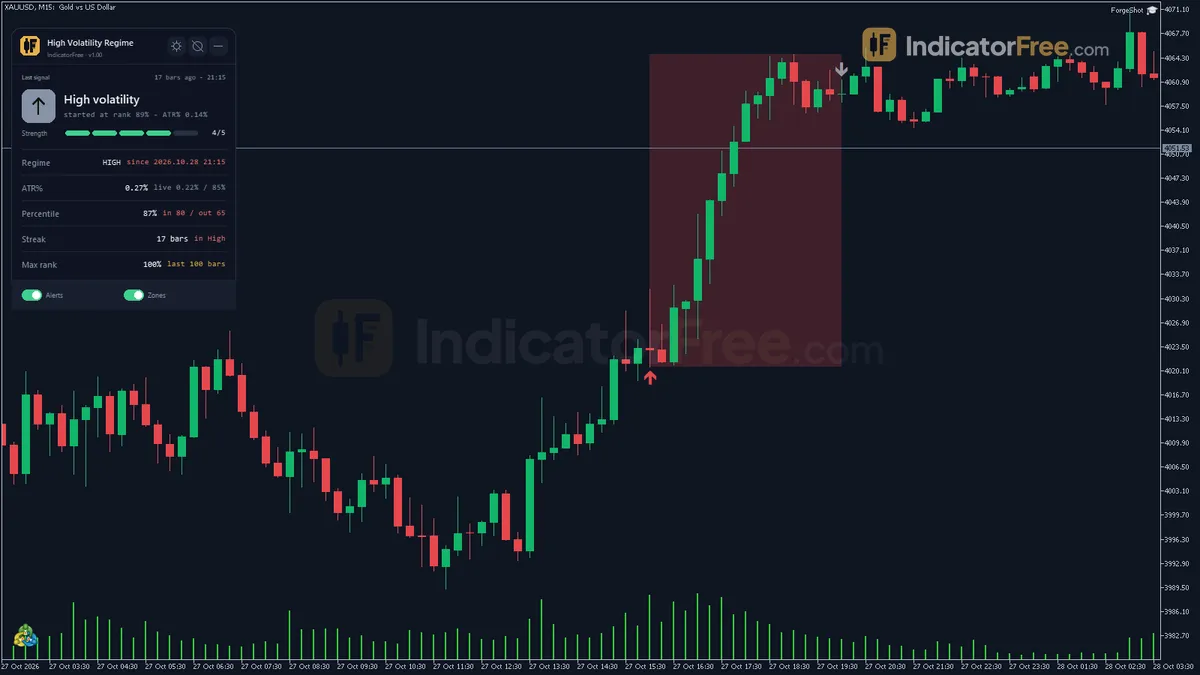
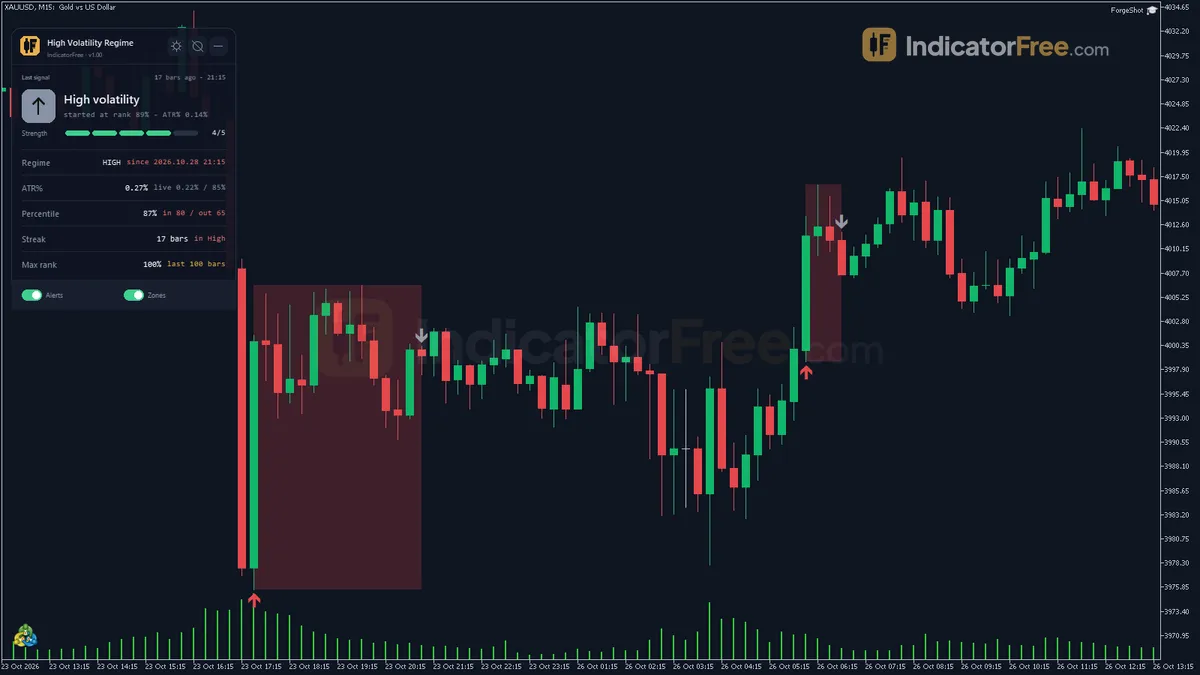
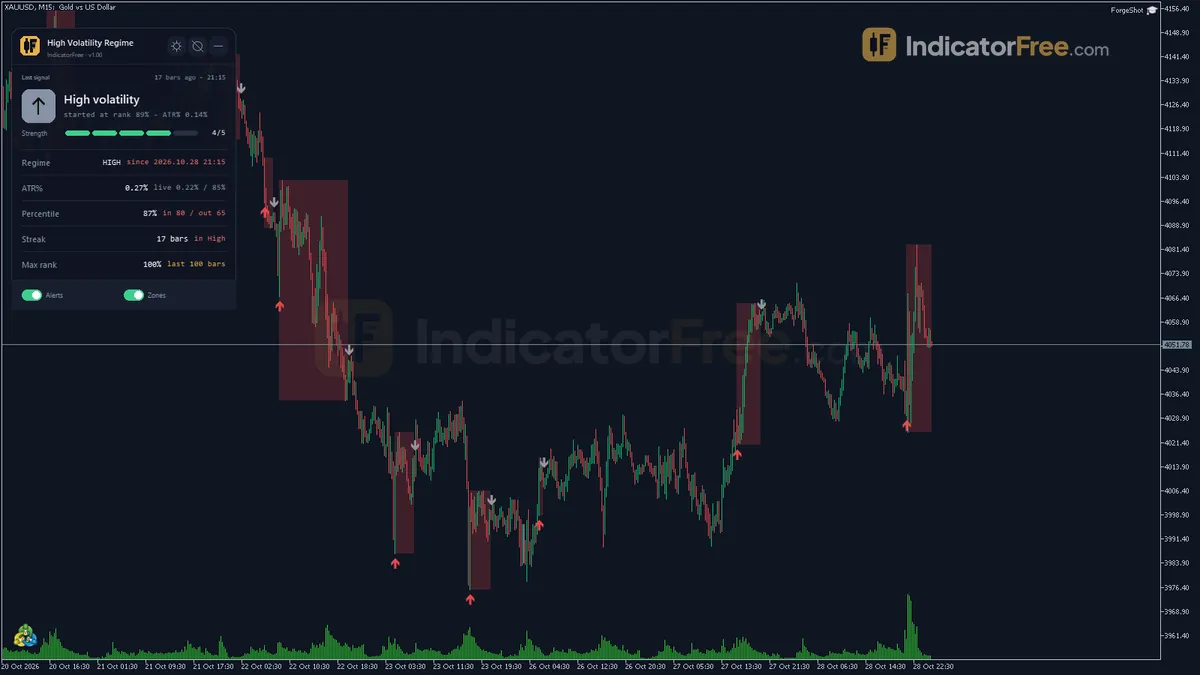
The tool measures Average True Range (ATR), the typical bar-to-bar movement, as a percentage of price. It then ranks today's value against recent history. When that rank climbs high enough, you get a High Vol Start arrow and a shaded High Vol Zone box. When the rank falls back, you get a High Vol End arrow. A Regime panel in the chart corner shows the live state. Nothing is drawn in a subwindow.
How the Lab tested it
The Lab ran version 1.00 on MT5 build 6230 (tested 2026-10-05) on EURUSD M15, from 2026-07-06 to 2026-10-02, using Raw Trading Ltd real ticks. It logged every arrow as it appeared and then checked whether any arrow moved or vanished later. The result: 0 of 170 changed, and the maximum arrow delay was 0 bars. Each arrow appears on the close of the bar it belongs to and then stays there.
All the numbers on this page come from that one symbol, timeframe and three-month period. The gallery screenshots also show the tool on other charts and on H4 and M5. Those are pictures of how it looks, not measured results.
What the 1-ATR numbers tell you
After each arrow, the Lab recorded whether price hit a 1-ATR move first, how many bars that took, and whether price touched 1 ATR at all within 20 bars. Across all 170 signals, the 1-ATR-first score was 50.9%. The median time to a hit was 3 bars, and only 3% of signals saw no 1-ATR touch within 20 bars.
In plain words: these arrows have no buy or sell direction, and a score this close to 50% confirms they don't predict one. What they do show is that price usually covers a full ATR within a few bars of an arrow. The tool tells you the market is moving, not where it is going. The split by arrow type is below.
Scale zoomed in to show the difference (bars do not start at zero).
Start arrows reached 1 ATR faster (median 2 bars, 1.2% with no touch in 20 bars) than End arrows (median 4 bars, 4.7% with no touch). That fits what the tool is meant to show: price moves faster right after a High regime begins than after it ends.
Who it is for
It suits traders who already have an entry method and want a clear, non-repainting label for when volatility is unusual. That label can help you adjust stop distance, position size, or which setups you take.
How it works
- 1Turns ATR into a percentage of the closing price for each bar.
ATR% = ATR / Close x 100Inputs: ATRPeriod - 2Ranks each ATR percentage against the previous bars: the share of past values at or below it.
Rank = 100 x count of past ATR% <= current / PercentileLookbackInputs: PercentileLookback - 3High volatility starts when rank reaches the high threshold and ends when it falls to the lower exit threshold.Inputs: HighVolThreshold, ExitThreshold
- 4Optionally the same rank on a higher timeframe must be within 10 points of the threshold to start.Inputs: UseHigherTFConfirm, ConfirmTimeframe
- 5Entry and exit arrows mark the change, and a shaded box spans the high and low of each regime.Inputs: ShowZoneShading, MaxZonesShown
Specifications
- Platform
- MetaTrader 5
- Version
- 1.00
- Type
- Indicator
- Window
- Main chart
- Draws
- 2 arrows, 1 zone, 1 panel
- Alerts
- popup, push, sound
- Repaints
- No (0 of 170 signals changed)
- Inputs
- 19
- Tested on
- MT5 build 6230 · 2026-10-05
Repaint test
No repaint detected. In a 6 Jul 2026 – 2 Oct 2026 test on EURUSD M15 (Raw Trading Ltd real ticks), 170 signals were logged at bar close and re-read at the end of the test: 0 changed. Arrows print on the bar that closes the signal, with no delay.
IndicatorFree — tested 2026-10-05 · MT5 build 6230 · Raw Trading Ltd real ticks. Results come from historical data, not live trading, and do not guarantee future results.
Signal statistics
Over 6 Jul 2026 – 2 Oct 2026 on EURUSD M15, the indicator printed 170 arrows. After 50.9% of them, price moved 1×ATR(14) in the arrow's direction before moving 1×ATR against it (median 3 bars). 3% reached neither level within 20 bars.
This measures price movement after the arrow, not a trading result. It includes no spread, commission, stop loss or position sizing.
What it draws
- Arrows (High Vol Start) from buffer 0, drawn on the closed bar.
- Arrows (High Vol End) from buffer 1, drawn on the closed bar.
- Rectangles (High Vol Zone) drawn as chart objects, not buffers — they are not readable by iCustom() in an EA.
- An on-chart panel (Regime); values shown in the panel are not exposed as buffers.
Inputs
| Input | Default | What it does |
|---|---|---|
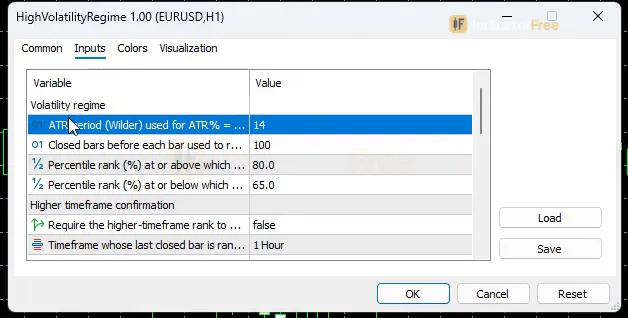
| ATRPeriod | 14 | ATR period (Wilder) used for ATR% = ATR / Close x 100 (5-50) |
| PercentileLookback | 100 | Closed bars before each bar used to rank its ATR% (20-500) |
| HighVolThreshold | 80 | Percentile rank (%) at or above which the regime turns High (50-99) |
| ExitThreshold | 65 | Percentile rank (%) at or below which a High regime returns to Normal (30-95, below HighVolThreshold) |
| UseHigherTFConfirm | false | Require the higher-timeframe rank to be at least HighVolThreshold - 10 to enter High |
| ConfirmTimeframe | H1 | Timeframe whose last closed bar is ranked for the confirmation |
| AlertOnRegimeStart | true | Alert when a High volatility regime starts |
| AlertOnRegimeEnd | false | Alert when a High volatility regime ends |
| EnablePopupAlert | true | Show the MT5 popup alert |
| EnablePushNotification | false | Send a push notification to the MT5 mobile app |
| EnableSoundAlert | true | Play a sound on alerts |
| SoundFile | alert2.wav | Sound file name (in the terminal Sounds folder) |
| ShowZoneShading | true | Shade each High volatility segment with a rectangle |
| MaxZonesShown | 100 | Newest High segments kept on the chart (1-500) |
| ShowDashboard | true | Show the status panel |
| PanelScale | 1 | Panel size multiplier (DPI is applied automatically) |
| PanelCorner | Left Upper | Chart corner for the panel |
| Theme | Dark | Chart color theme |
| RestoreTheme | true | Restore the original chart colors when the indicator is removed |
How to read it
Install
Copy the file (147.9 KB) into your MT5 MQL5/Indicators folder, refresh the Navigator and drag High Volatility Regime onto a chart.
How the regime is measured
First, the tool turns ATR into ATR%, which is ATR / Close x 100, using ATRPeriod (Wilder). Because it is a percentage of price, the value means the same thing on a low-priced pair and a high-priced instrument.
Next, it gives each closed bar a percentile rank: 100 x the number of past ATR% values at or below the current one, divided by PercentileLookback. A rank of 80 means the current ATR% is as high as or higher than 80% of the previous closed bars.
The switch uses hysteresis, meaning two different thresholds. The regime turns High when the rank reaches HighVolThreshold (80) and returns to Normal only when it drops to ExitThreshold (65). The gap between the two stops the label from flickering on and off around a single line.
Reading the arrows, the zone and the panel
- High Vol Start: the previous closed bar was Normal, and this bar closed with a rank at or above
HighVolThreshold. On the EURUSD M15 test this fired 6.7 times a week. - High Vol End: the previous closed bar was High, and this bar closed with a rank at or below
ExitThreshold. This also fired 6.7 times a week. - High Vol Zone: a rectangle that spans the high and low of each High segment. Only the newest
MaxZonesShownsegments are kept, and the oldest is deleted when a new one starts. - Regime panel: shows the current regime (High / Normal), ATR% and its rank with live values for the forming bar, the streak of bars in the current regime, the highest rank in the lookback and, if enabled, the higher-timeframe rank.
The drawing below is an illustration of a typical cycle. Compare it with the real screenshots next to it in the gallery: the signal close-ups show actual arrows and boxes, and the panel close-up shows the live readout.
A common misread: the panel's live rank can pass 80 while a bar is still forming, but no arrow appears until the bar closes. If the bar closes back below the threshold, the regime stays Normal. Trust the arrow, not the mid-bar panel reading. A second misread is treating a Start arrow as a buy or sell signal. It has no direction, and the box covers both sides of the move.
Inputs to change first
HighVolThreshold(80, range 50-99): raise it to mark only the most extreme phases and get fewer arrows. Lower it to flag High more often.ExitThreshold(65, range 30-95, belowHighVolThreshold): a narrow gap to the entry threshold means shorter regimes and more flips. A wide gap keeps the High label on longer.PercentileLookback(100, range 20-500): this sets what counts as "normal". A short window reacts to the last few sessions, while a long one compares against weeks.ATRPeriod(14, range 5-50): a shorter period reacts to volatility sooner but is noisier.UseHigherTFConfirm(off) withConfirmTimeframe(H1): when on, a High regime can start only if the last closed bar on the higher timeframe ranks at leastHighVolThreshold- 10 (70 with the default). This filters out bursts that stay on the lower timeframe only.
Alerts
By default, AlertOnRegimeStart is on and AlertOnRegimeEnd is off, so you hear only about new High phases. Alerts can appear as an MT5 popup (EnablePopupAlert), as a push notification to the MT5 mobile app (EnablePushNotification, off by default) and as a sound (EnableSoundAlert, playing SoundFile alert2.wav from the terminal Sounds folder).
Decision rule
Read a Start arrow as a change of conditions, not a trade. One way to use it, which the Lab has not tested, is to pause mean-reversion and tight-stop setups, or size them down, until an End arrow prints. Only then go back to your normal plan. Never take a trade because of a Start arrow alone, because the arrow gives no direction.
Installation
- 1Download HighVolatilityRegime.ex5 from the button above (Google Drive).
- 2In MetaTrader 5: File → Open Data Folder → MQL5 → Indicators. Copy HighVolatilityRegime.ex5 there.
- 3Restart MT5 or right-click Indicators in Navigator → Refresh.
- 4Drag High Volatility Regime onto a chart. For push alerts, enable "Allow push notifications" under Tools → Options → Notifications.
- Tested on MT5 build 6230.
Key terms and guides
- high volatility
- High volatility means price is moving much more per candle than is normal for that market and timeframe: bigger candles, wider ranges and a rising ATR. It describes the size of the moves, not their direction.
- Stop Loss Distance
- Stop loss distance is the gap between your entry price and your stop loss price, usually counted in pips. Together with your lot size, it decides how much money you lose if the stop is hit.
- Average True Range
- Average True Range (ATR) is a volatility indicator that shows how far price typically moves per candle, gaps included, averaged over a set number of candles. It measures the size of moves, not their direction.
- Every tick based on real ticks
- Every tick based on real ticks is the MT5 Strategy Tester mode that replays the actual bid and ask ticks your broker recorded, with the real changing spread, instead of ticks the tester invents from 1-minute bars.
- Position Size
- Position size is how many units or lots you buy or sell in one trade. You set it from the money you are willing to lose and the distance to your stop-loss, so a stop that gets hit costs a planned amount.
- Symbol
- A symbol is the short code a trading platform uses to name one tradable market, such as EURUSD for the euro against the US dollar or XAUUSD for gold. Every quote, chart and order is tied to exactly one symbol.
More on this subject: Volatility & ranges guide, terms and tools
User reviews
No reviews yet. Members who download the tool can review it here.
Sign in and download the tool to review it.
Build a checklist with it
High Volatility Regime does one job on the chart: trend / context. Put it on the same chart as the tools below and the IndicatorFree panels merge into one checklist card, ordered trend, zone, signal, risk.
- Zone / levelOrder Block LocatorAdds where price is: the zones and levels that High Volatility Regime does not draw.
- Entry signalCCIAdds the entry signal: the moment to act once High Volatility Regime has set the scene.
The Lab has not tested these combinations. Each tool is tested on its own; the card only lines up what each one says. Free members get 2 new tools a day. If one has to wait until tomorrow, install BlackBox to raise the limit to 5 a day (20 on a live account).
FAQ
Does High Volatility Regime repaint?
No repaint detected. In a 6 Jul 2026 – 2 Oct 2026 test on EURUSD M15 (Raw Trading Ltd real ticks), 170 signals were logged at bar close and re-read at the end of the test: 0 changed. Arrows print on the bar that closes the signal, with no delay.
Can I use High Volatility Regime in an EA?
Yes. Read buffer 0 (High Vol Start) with iCustom() on bar 1 — the last closed bar.
Why can’t my EA read the zones?
Zones and the panel are chart objects, not indicator buffers, so iCustom() does not return them.
How do I get alerts on my phone?
Enter your MetaQuotes ID under Tools → Options → Notifications, tick "Enable push notifications", and keep the push alert input on.
Does it work on other pairs?
Tested on EURUSD only; other symbols not tested.
Can I get High Volatility Regime alerts on my phone?
Yes. Set `EnablePushNotification` to true and the alert goes to the MT5 mobile app linked to your terminal. Turn on `AlertOnRegimeEnd` too if you also want to know when a High phase finishes.
Does it work on gold, indices or crypto, not just forex?
It ranks ATR as a percentage of price, so it can be read the same way on any symbol in MT5. However, the Lab's numbers come only from EURUSD M15, so on other symbols you are working from the pictures and your own testing.
Why do older shaded boxes disappear from my chart?
Only the newest `MaxZonesShown` High segments are kept (100 by default), and the oldest box is deleted when a new one starts. You can raise the limit up to 500 to keep more history visible.
Will it change my chart colours?
It applies the `Theme` you choose (Dark by default). With `RestoreTheme` left on, your original chart colours come back when you remove the indicator.
Changelog
- 1.00Initial release: High Volatility Regime classifies every closed bar as High or Normal volatility using the percentile rank of ATR% (ATR as a percent of price) against its recent history, with two-threshold hysteresis. · 2026-10-09
Final verdict
Lab verdict: a clean regime label, not an entry signal
The tool does one job and does it reliably. The repaint test found no changed or late arrows, and the regime switch is easy to read thanks to the two-threshold hysteresis. The numbers also show that price usually moves a full ATR within a few bars of an arrow. That is useful context for setting stops and position size.
The limits are just as clear. The 1-ATR-first score is a coin flip, so the tool says nothing about direction. ATR is built from past bars, so a Start arrow confirms that volatility has already risen and does not warn you before it does. "High" is also relative to the lookback only: after a long quiet stretch, a modest move can rank as High. Finally, all the Lab numbers come from one pair, one timeframe and three months.
Who should skip it
Skip it if you want arrows that tell you to buy or sell, or if your strategy already sizes everything by ATR, because the tool would then repeat what you have. It also adds little on higher timeframes if you trade only a couple of setups a week, because you will rarely need a regime label.
- –You need a non-repainting label for unusual volatility
- –You change stop distance or size by conditions
- –You want to avoid fading moves during active phases
- –You want buy or sell arrows
- –You expect a warning before volatility rises
- –Your rules already scale everything by ATR
Settings to start with
Start with the defaults (80 / 65, lookback 100, ATR 14). They are the settings shown in the Inputs screenshot. On M5, one idea is to raise PercentileLookback to 200 so that "normal" covers more than a single session. On H4, you could try 50 so the ranking does not reach back months. Neither value was tested by the Lab, so compare each with the default on your own chart. If the regime flips too often, widen the gap by lowering ExitThreshold to 50 (inside its 30-95 range, also untested by the Lab) before you touch anything else.
A tool to try alongside it
This tool tells you volatility is unusual compared with recent bars, but not how much of the day's typical range has already been used. Average Daily Range adds that, so you can see whether a High phase starts early or late in the day's normal travel. This pairing is only an idea: the Lab has not tested the two tools together.