Keltner Channel
Free MT5 Keltner Channel: EMA middle line, ATR bands, breakout arrows, reversion dots, alerts and a panel. Lab: 0 of 427 signals changed.
- Repainted
- 0 / 427
- Signals / week
- ≈ 32.5
- Tested on
- EURUSD M15
- Tested
- 2026-10-09
Overview
The Keltner Channel indicator for MT5 draws an EMA middle line and two ATR bands on your main price chart. It marks Breakout Up and Breakout Down arrows and Reversion dots on closed bars, and it shows a status panel. In the Lab's repaint test on EURUSD M15 real ticks, 0 of 427 signals changed after they appeared.
It is for traders who want to see when price stretches outside its normal range, how long it stays out there, and when it comes back.
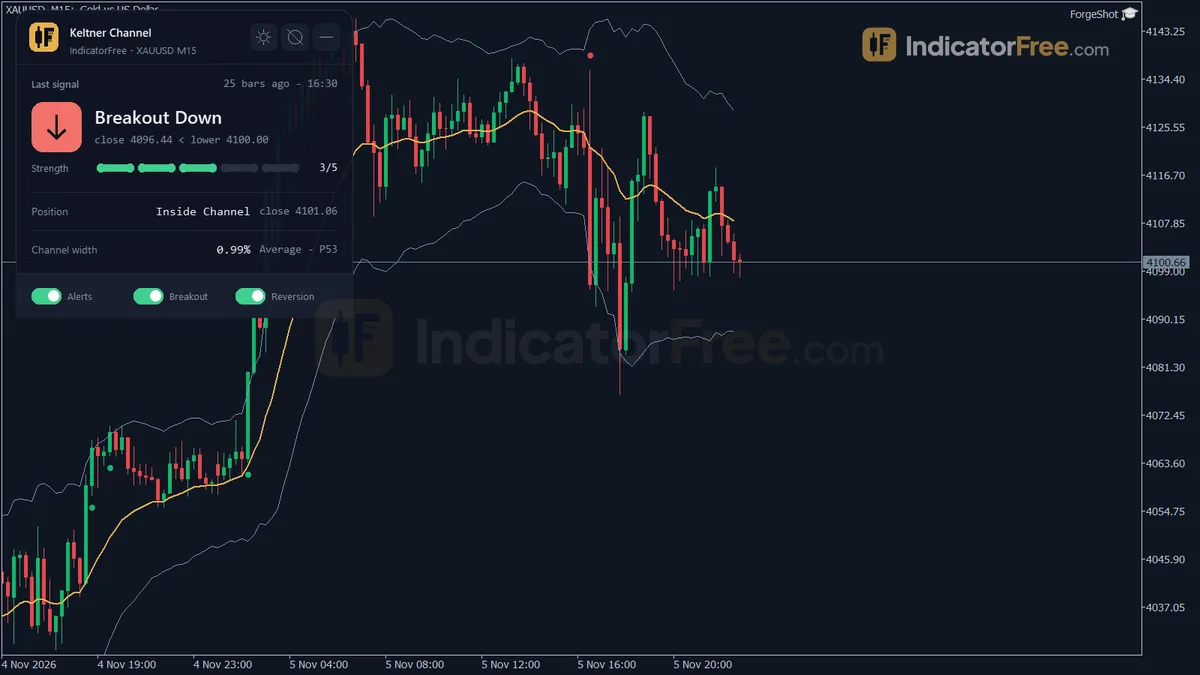
What it draws on your chart
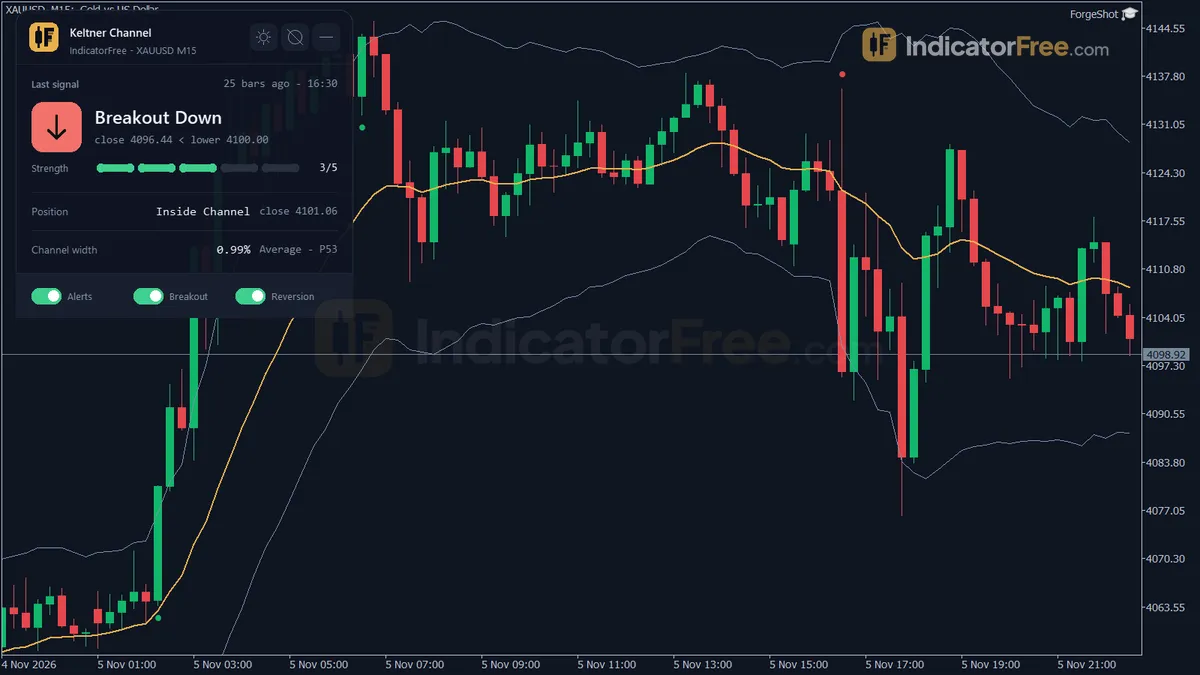
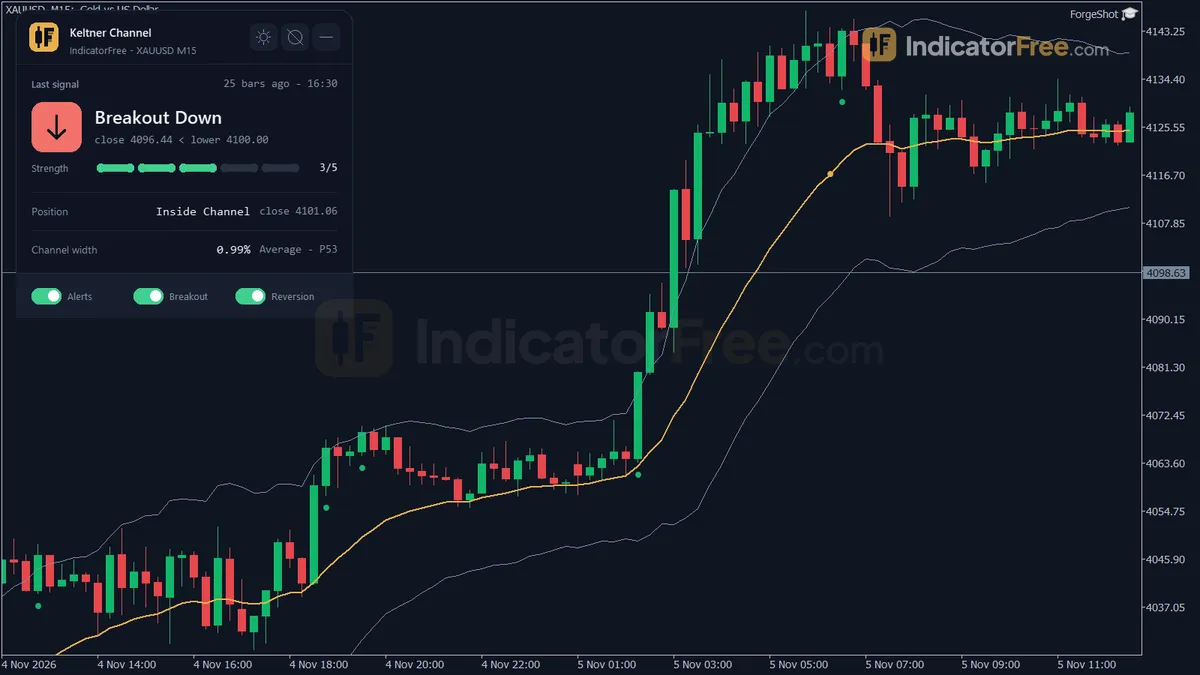
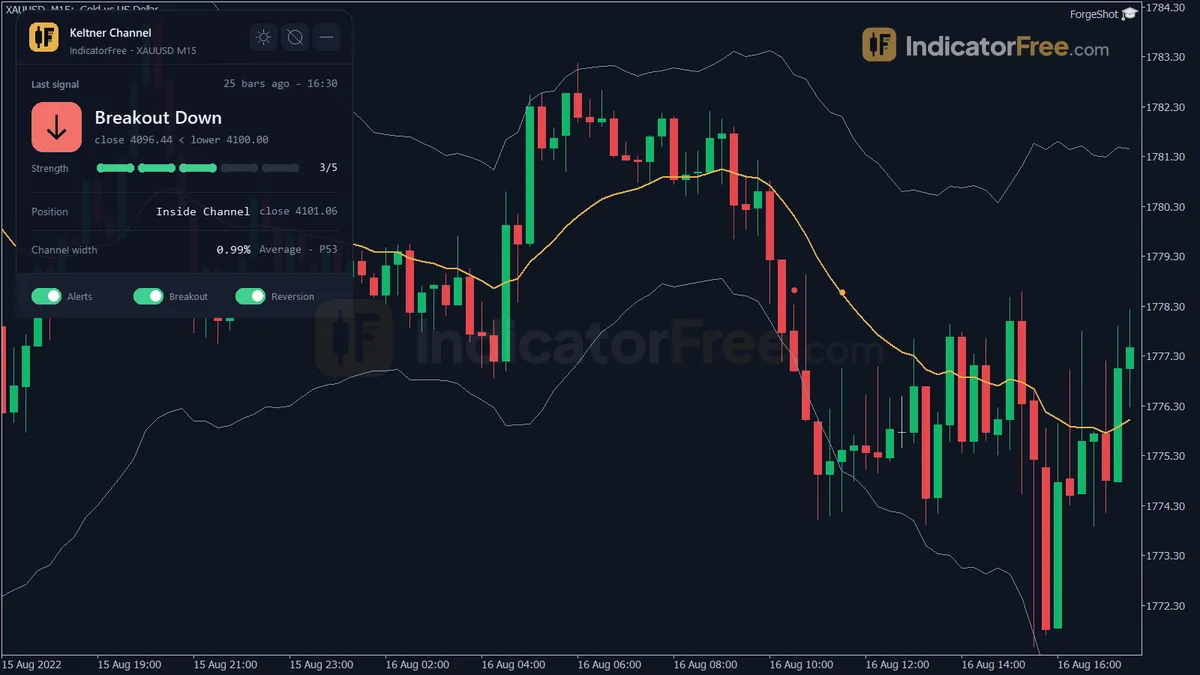
A Keltner Channel is a volatility envelope: a moving average with bands set a multiple of ATR above and below it. This build uses an EMA of the close for the middle line and a Wilder-smoothed ATR for the band distance. Everything is calculated on closed bars only.
- Middle EMA: the centre line of the channel.
- Upper Band / Lower Band: each close outside a band counts toward a Band Ride, a run of closes outside on the same side.
- Breakout Up / Breakout Down arrows: the first close outside a band.
- Reversion dots: placed on the middle line when price closes back inside after a ride.
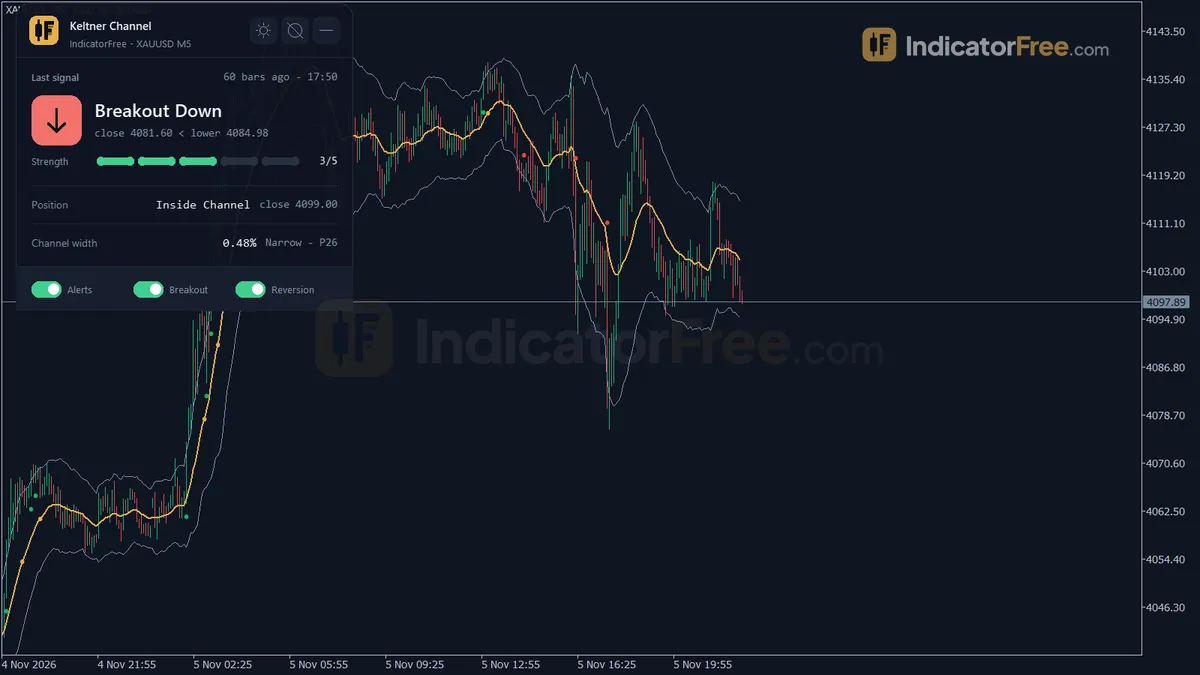
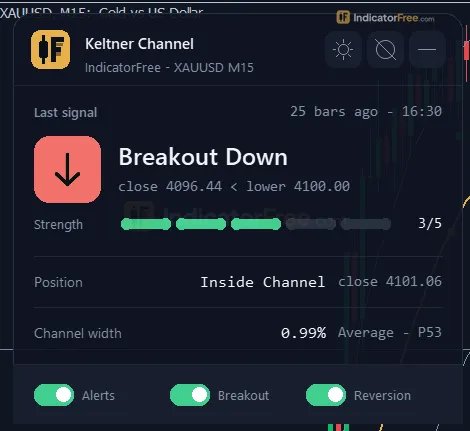
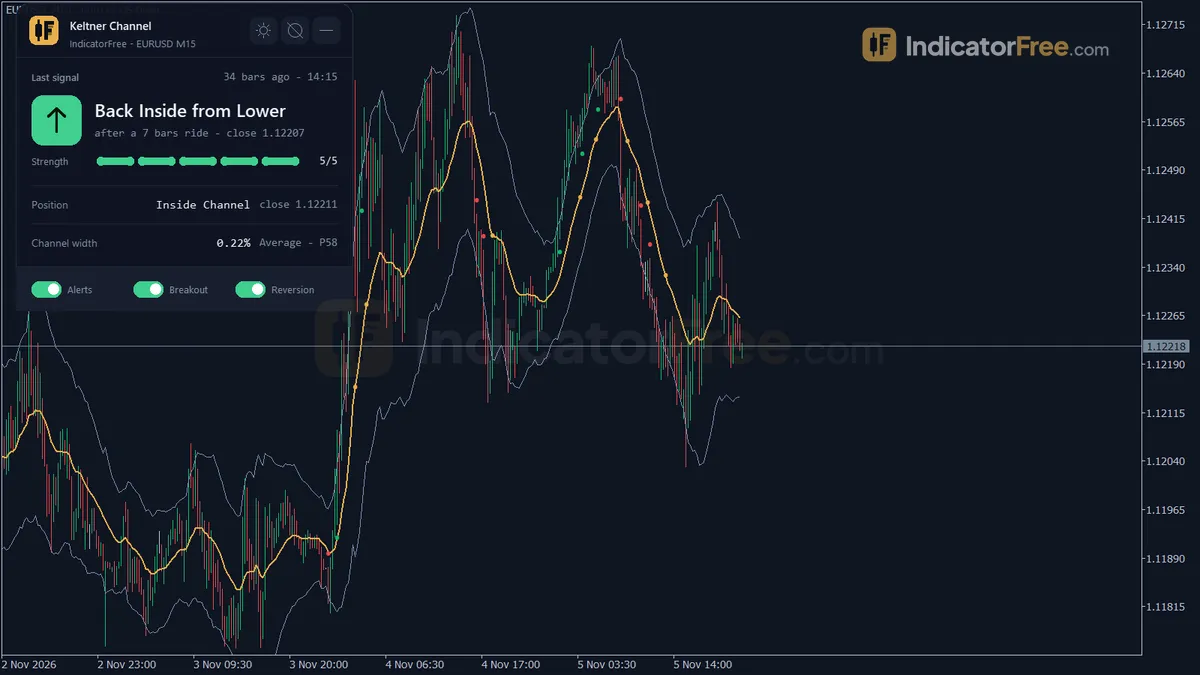
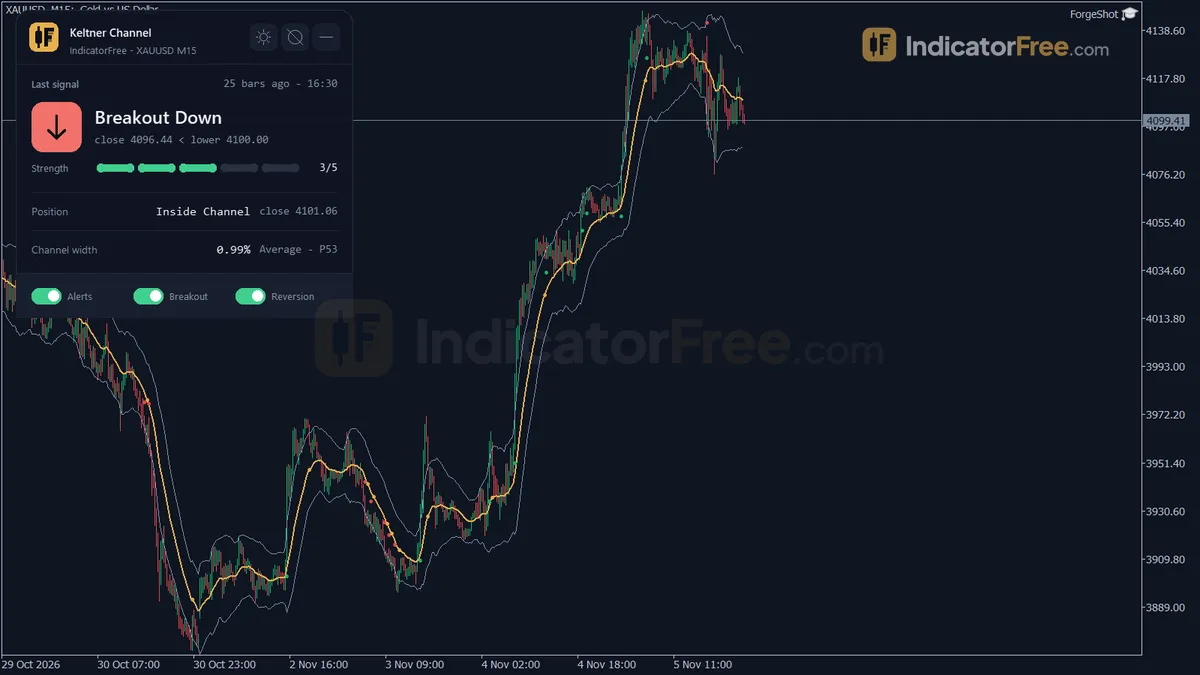
- Channel panel: the current state of the channel at a glance.
All of it sits in the price window. There is no subwindow.
How the Lab tested it
The Lab ran version 1.00 on MT5 build 6230 on EURUSD M15 from 2026-07-09 to 2026-10-08, using Raw Trading Ltd real ticks. It logged every signal the moment it appeared, then compared the log with the finished history.
- Repaint: 0 of 427 signals changed, and the maximum arrow delay was 0 bars. Once an arrow or dot appears, it stays where it is.
- Direction: the bars below show how often each signal type reached 1 ATR in its own direction before it moved 1 ATR against. None of the three types reached 50%. In this test the signals gave no edge on their own, so read them as location marks (where price is relative to its range), not as entries.
- Speed: price needed a median of 2 bars to travel 1 ATR, and only 1.4% of signals saw no 1 ATR move within 20 bars. A signal tells you price is about to move. It does not tell you which way the move will go.
- Frequency: 32.5 signals a week across all three types with the default settings.
Scale zoomed in to show the difference (bars do not start at zero).
Who it is for
It suits traders who use bands for context. You can see whether a close is stretched, how long a ride has lasted, and whether the channel is narrow or wide compared with recent history. It is not a complete buy/sell system, and the Lab results do not support using it as one.
How it works
- 1Builds the middle line as an exponential moving average of close, seeded with a simple average of the first bars.
EMA = Close x k + EMA_prev x (1 - k), k = 2 / (EmaPeriod + 1)Inputs: EmaPeriod - 2Computes true range and smooths it into a Wilder-style ATR.
ATR = (ATR_prev x (AtrPeriod - 1) + TR) / AtrPeriodInputs: AtrPeriod - 3Places the upper and lower bands a multiple of ATR away from the middle line.
Upper = EMA + Multiplier x ATR, Lower = EMA - Multiplier x ATRInputs: Multiplier - 4Marks a breakout when a bar closes outside a band after the previous bar did not, and counts closes outside.Inputs: ShowBreakouts
- 5Marks reversion at the middle line when price closes back inside after riding outside for the minimum number of bars.Inputs: MinRideForReversion, ShowReversion
Specifications
- Platform
- MetaTrader 5
- Version
- 1.00
- Type
- Indicator
- Window
- Main chart
- Draws
- 3 lines, 3 arrows, 1 panel
- Alerts
- popup, push, sound
- Repaints
- No (0 of 427 signals changed)
- Inputs
- 19
- Tested on
- MT5 build 6230 · 2026-10-09
Repaint test
No repaint detected. In a 9 Jul 2026 – 8 Oct 2026 test on EURUSD M15 (Raw Trading Ltd real ticks), 427 signals were logged at bar close and re-read at the end of the test: 0 changed. Arrows print on the bar that closes the signal, with no delay.
IndicatorFree — tested 2026-10-09 · MT5 build 6230 · Raw Trading Ltd real ticks. Results come from historical data, not live trading, and do not guarantee future results.
Signal statistics
Over 9 Jul 2026 – 8 Oct 2026 on EURUSD M15, the indicator printed 427 arrows. After 43% of them, price moved 1×ATR(14) in the arrow's direction before moving 1×ATR against it (median 2 bars). 1.4% reached neither level within 20 bars.
This measures price movement after the arrow, not a trading result. It includes no spread, commission, stop loss or position sizing.
What it draws
- A line (Middle EMA) from buffer 0.
- A line (Upper Band) from buffer 1.
- A line (Lower Band) from buffer 2.
- Arrows (Breakout Up) from buffer 3, drawn on the closed bar.
- Arrows (Breakout Down) from buffer 4, drawn on the closed bar.
- Arrows (Reversion) from buffer 5, drawn on the closed bar.
- An on-chart panel (Channel); values shown in the panel are not exposed as buffers.
Inputs
| Input | Default | What it does |
|---|---|---|
| EmaPeriod | 20 | EMA period of the Close used for the middle line (5-100) |
| AtrPeriod | 10 | ATR period (Wilder smoothing) used for the band distance (5-50) |
| Multiplier | 2 | Upper / Lower band = Middle +/- Multiplier x ATR (0.5-5.0) |
| MinRideForReversion | 2 | Bars closed outside in a row needed before a close back inside counts as Reversion (1-10) |
| RefLookback | 100 | Closed bars used for the channel width percentile rank on the panel (50-500) |
| ShowBreakouts | true | Show Breakout Up / Down arrows |
| ShowReversion | true | Show Reversion dots |
| UseHTFContext | true | Show the Keltner Channel position of a higher timeframe on the panel |
| HTFTimeframe | H4 | Timeframe used for the higher timeframe context |
| EnableBreakoutAlert | true | Alert when a Breakout Up / Down is confirmed on a closed bar |
| EnableReversionAlert | true | Alert when a Reversion is confirmed on a closed bar |
| AlertPopup | true | Show a popup alert in the terminal |
| AlertPush | false | Send a push notification to the MT5 mobile app |
| AlertSound | false | Play a sound with the alert |
| SoundFile | alert.wav | Sound file in the MT5 Sounds folder |
| ShowPanel | true | Show the status panel |
| PanelScale | 1 | Panel size multiplier (DPI is applied automatically) |
| Theme | Dark | Chart color theme |
| RestoreTheme | true | Restore the original chart colors when the indicator is removed |
How to read it
Install: copy the file into your MT5 MQL5 > Indicators folder, refresh the Navigator and drag Keltner Channel onto a chart.
Reading the three lines
- Middle EMA: the average close, and the line price returns to after a ride.
- Upper Band: a close above it is outside the channel on the upper side and counts toward the upward Band Ride. A close below it is inside the channel.
- Lower Band: a close below it is outside the channel on the lower side and counts toward the downward Band Ride. A close above it is inside the channel.
The band distance is Multiplier x ATR, so the channel widens when bars get bigger and narrows when the market goes quiet.
Breakout Up and Breakout Down arrows
- Breakout Up fires when a closed bar closes above the upper band and the bar before it did not. The arrow sits below that bar's low. On EURUSD M15 it fired 10 times a week.
- Breakout Down fires when a closed bar closes below the lower band and the bar before it did not. The arrow sits above that bar's high. It fired 11.1 times a week.
Only the first close outside gets an arrow. Later closes outside add to the Band Ride count without drawing new arrows. Multiplier is the input that controls them.
Reversion dots
A Reversion dot fires when a closed bar closes back inside the channel after at least MinRideForReversion bars in a row closed outside on the same side. The dot is drawn on the middle line. On EURUSD M15 it fired 11.4 times a week.
Common misread: the dot sits on the middle line, but it fires on the bar that closes back inside the band. Price has usually not reached the middle line yet. Read the dot as the ride has ended, not as price has reached the average.
The illustration below shows one full sequence. The bands are drawn flat for clarity, and with the default MinRideForReversion of 2 the short poke on the right gets no dot.
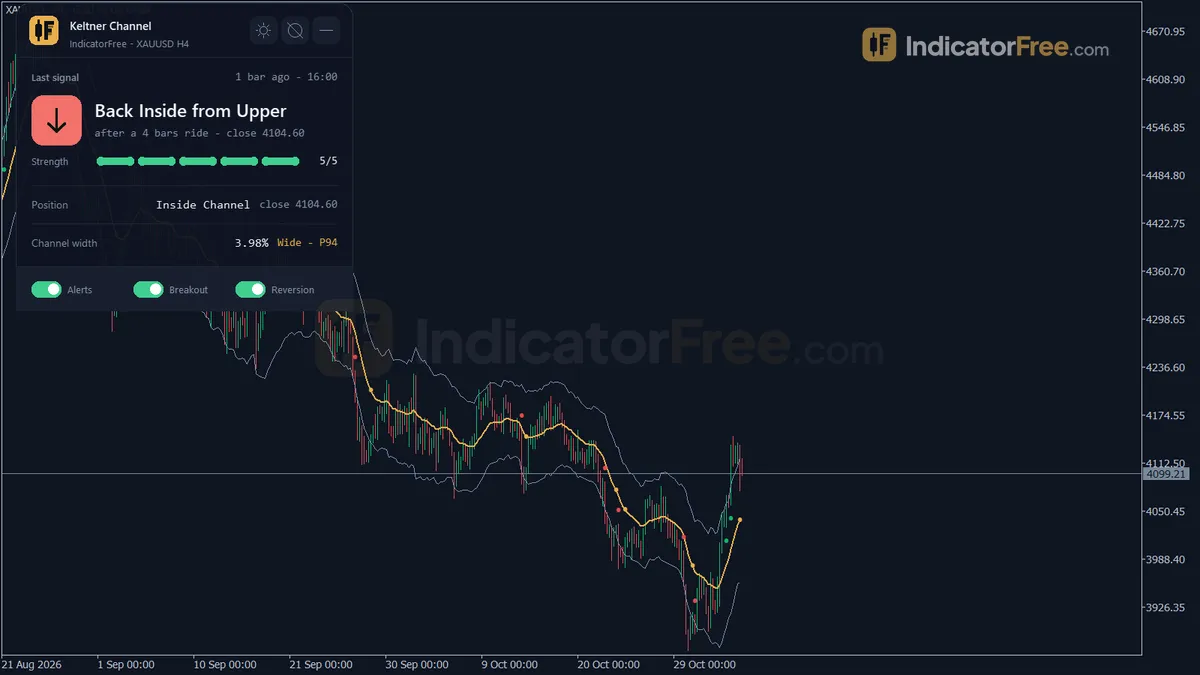
The Channel panel
The panel shows:
- the last channel signal and how many bars ago it fired
- the close position
- the current Band Ride count
- the channel width in % with its percentile rank over the last RefLookback closed bars
- the Keltner Channel position on the higher timeframe
- the close position as a % of the channel
- the ATR
Inputs to change first
- Multiplier (default 2, range 0.5-5.0): sets how far the bands sit from the middle line. A lower value gives a narrower channel with more breakouts and longer rides. A higher value gives fewer, more stretched signals.
- MinRideForReversion (default 2, range 1-10): how many closes outside in a row are needed before a close back inside counts as a Reversion. Raise it to keep only the dots that end longer rides.
- HTFTimeframe (default H4) with UseHTFContext: picks the higher timeframe whose channel position appears on the panel. Choose one well above your chart timeframe.
- EmaPeriod (default 20, range 5-100) and AtrPeriod (default 10, range 5-50): longer periods give a smoother channel that reacts more slowly.
- RefLookback (default 100, range 50-500): the number of closed bars used for the width percentile rank.
- ShowBreakouts / ShowReversion / ShowPanel: hide what you do not use. Theme, PanelScale and RestoreTheme change the look only.
Alerts
With EnableBreakoutAlert and EnableReversionAlert on, an alert fires when the signal is confirmed on a closed bar. AlertPopup (on by default) shows a popup in the MT5 terminal. AlertPush (off by default) sends a push notification to the MT5 mobile app. AlertSound (off by default) plays SoundFile, which defaults to alert.wav, from the MT5 Sounds folder.
A decision rule for each signal
These rules are ideas to try. The Lab has not tested them.
- Breakout arrow: consider it only when the panel's higher timeframe position is on the same side of its channel. For example, take a Breakout Up only when the higher timeframe close is in the upper part of its channel. Skip it when the higher timeframe disagrees.
- Reversion dot: use it to manage a trade you already hold in the direction of the ride, for example to take profit or tighten the stop. Do not read it as a new entry on its own.
- Any signal: price usually covers 1 ATR within a couple of bars, so a stop closer than 1 ATR will often be reached quickly in either direction.
Installation
- 1Download KeltnerChannel.ex5 from the button above (Google Drive).
- 2In MetaTrader 5: File → Open Data Folder → MQL5 → Indicators. Copy KeltnerChannel.ex5 there.
- 3Restart MT5 or right-click Indicators in Navigator → Refresh.
- 4Drag Keltner Channel onto a chart. For push alerts, enable "Allow push notifications" under Tools → Options → Notifications.
- Tested on MT5 build 6230.
Key terms and guides
- Average True Range
- Average True Range (ATR) is a volatility indicator that shows how far price typically moves per candle, gaps included, averaged over a set number of candles. It measures the size of moves, not their direction.
- Moving average
- A moving average is a line drawn from the average closing price of a set number of recent candles, recalculated on every new candle. It smooths out price noise and shows which way the trend is pointing.
- Every tick based on real ticks
- Every tick based on real ticks is the MT5 Strategy Tester mode that replays the actual bid and ask ticks your broker recorded, with the real changing spread, instead of ticks the tester invents from 1-minute bars.
- Exponential moving average
- The exponential moving average (EMA) is a moving average that gives the newest closes the most weight, so it turns sooner than a simple moving average. Traders use it to read trend direction and to time entries on pullbacks.
- Keltner Channel
- The Keltner Channel is a volatility indicator. It draws a moving-average middle line and two bands set a multiple of the Average True Range above and below it, so you can see when price is stretched or breaking into a trend.
- Support
- Support is a price zone where a falling market has stopped and turned higher more than once because buyers stepped in there. Traders use it to choose where to buy, and they put the stop loss just below the zone so a clean break ends the trade.
More on this subject: Volatility & ranges guide, terms and tools
User reviews
No reviews yet. Members who download the tool can review it here.
Sign in and download the tool to review it.
Build a checklist with it
Keltner Channel does one job on the chart: zone / level. Put it on the same chart as the tools below and the IndicatorFree panels merge into one checklist card, ordered trend, zone, signal, risk.
- Trend / contextEMA Trend WallAdds the trend side: which way the market leans before you act on Keltner Channel.
- Entry signalReversion Z-ScoreAdds the entry signal: the moment to act once Keltner Channel has set the scene.
The Lab has not tested these combinations. Each tool is tested on its own; the card only lines up what each one says. Free members get 2 new tools a day. If one has to wait until tomorrow, install BlackBox to raise the limit to 5 a day (20 on a live account).
FAQ
Does Keltner Channel repaint?
No repaint detected. In a 9 Jul 2026 – 8 Oct 2026 test on EURUSD M15 (Raw Trading Ltd real ticks), 427 signals were logged at bar close and re-read at the end of the test: 0 changed. Arrows print on the bar that closes the signal, with no delay.
Can I use Keltner Channel in an EA?
Yes. Read buffer 3 (Breakout Up) with iCustom() on bar 1 — the last closed bar.
Why can’t my EA read the zones?
Zones and the panel are chart objects, not indicator buffers, so iCustom() does not return them.
How do I get alerts on my phone?
Enter your MetaQuotes ID under Tools → Options → Notifications, tick "Enable push notifications", and keep the push alert input on.
Does it work on other pairs?
Tested on EURUSD only; other symbols not tested.
Which pairs and timeframes was the Keltner Channel tested on?
The Lab tested it only on EURUSD M15 from 2026-07-09 to 2026-10-08. It runs on any symbol and timeframe, and the screenshots show it on H4 and M5, but those charts are not test results. Check how it behaves on your own market before you rely on it.
Why does no arrow appear while the current bar is already outside the band?
The indicator calculates on closed bars only. The arrow or dot, and its alert, appear when the bar closes outside or back inside. A live bar that pokes through the band and closes back inside gets no signal.
Can I keep the channel and hide the arrows or the panel?
Yes. Set ShowBreakouts and ShowReversion to false to hide the arrows and dots, and set ShowPanel to false to hide the panel. The three lines stay on the chart.
Will it change my chart colors?
It applies the chart theme set in Theme, which is Dark by default. With RestoreTheme set to true, your original chart colors come back when you remove the indicator.
Which version and MT5 build does this page cover?
Version 1.00, a 148.6 KB file, tested on MT5 build 6230 on 2026-10-09. It is the first release: the EMA middle line with Wilder-smoothed ATR bands, calculated on closed bars only.
Changelog
- 1.00Initial release: modern Keltner Channel (EMA middle line with Wilder-smoothed ATR bands, SMA-seeded) calculated on closed bars only (no repaint). · 2026-10-09
Final verdict
The Lab's judgement
This is a well-built location tool. It has a clean repaint result, alerts that fire only on confirmed closes, and a panel that answers the questions a band trader keeps asking: how stretched is price, how long has the ride lasted, how wide is the channel compared with recent bars, and where is the higher timeframe. Reversion dots scored best of the three signal types. Breakout arrows scored weakest, which fits the usual pattern: a first close outside a band often gets pulled back in.
The arrows are not an edge on their own. Every signal type stayed under 50% in the 1 ATR test, and the Lab tested only one symbol, one timeframe and one three-month period. Results on other pairs or timeframes are unknown.
The figure below sums up when it is worth the space on your chart.
- –You want to see whether a close is stretched outside its normal range
- –You manage trades by how long a Band Ride lasts
- –You check higher timeframe position before acting on a lower timeframe
- –You want alerts only on confirmed closes
- –You want arrows to buy and sell on without a filter
- –You need alerts during the bar, before it closes
- –You only trade symbols or timeframes you need tested evidence for
- –Your stops are tighter than 1 ATR
Settings to start with
Start with the defaults. They are what the Lab tested. Then try these starting points, which the Lab has not tested, and compare each with the default on your own chart:
- On M5: if the arrows clutter the chart, try Multiplier 2.5.
- To keep only Reversion dots after longer rides: try MinRideForReversion 3.
- On H1: set HTFTimeframe to D1 so the panel's context comes from a timeframe well above your chart.
Tools to pair it with
The Keltner Channel shows where price sits in its own range. It does not show whether the market as a whole is in a quiet or a wild phase. Deviation Spectrum labels the volatility regime, and Average Daily Range shows how much of a normal day's range is already used. Together they could help you skip breakouts that come late in an exhausted day. This is an idea to try, not a Lab result: the Lab has not tested the pair.