Low Volatility
Free MT5 Low Volatility indicator: marks ATR-percentile quiet streaks, boxes them and flags the expansion bar. Lab: 0 of 141 signals changed.
- Repainted
- 0 / 141
- Signals / week
- ≈ 11.1
- Tested on
- EURUSD M15
- Tested
- 2026-10-05
Overview
Low Volatility is a free MT5 indicator for the main price chart. It puts an arrow on each bar of a confirmed low-volatility streak, draws a box over the streak's high-low and marks the bar where volatility expands again. In the Lab's repaint test on EURUSD M15, 0 of 141 signals changed after they appeared. It helps traders who need to know when a market is quiet and when that quiet phase has ended.
What the indicator measures
Volatility contraction is a stretch where bar ranges are small compared with recent history. Low Volatility measures this with a Wilder ATR. It then ranks the current ATR against the last PercentileWindow bars. So "low" always means low for this symbol and timeframe, not a fixed number of pips.
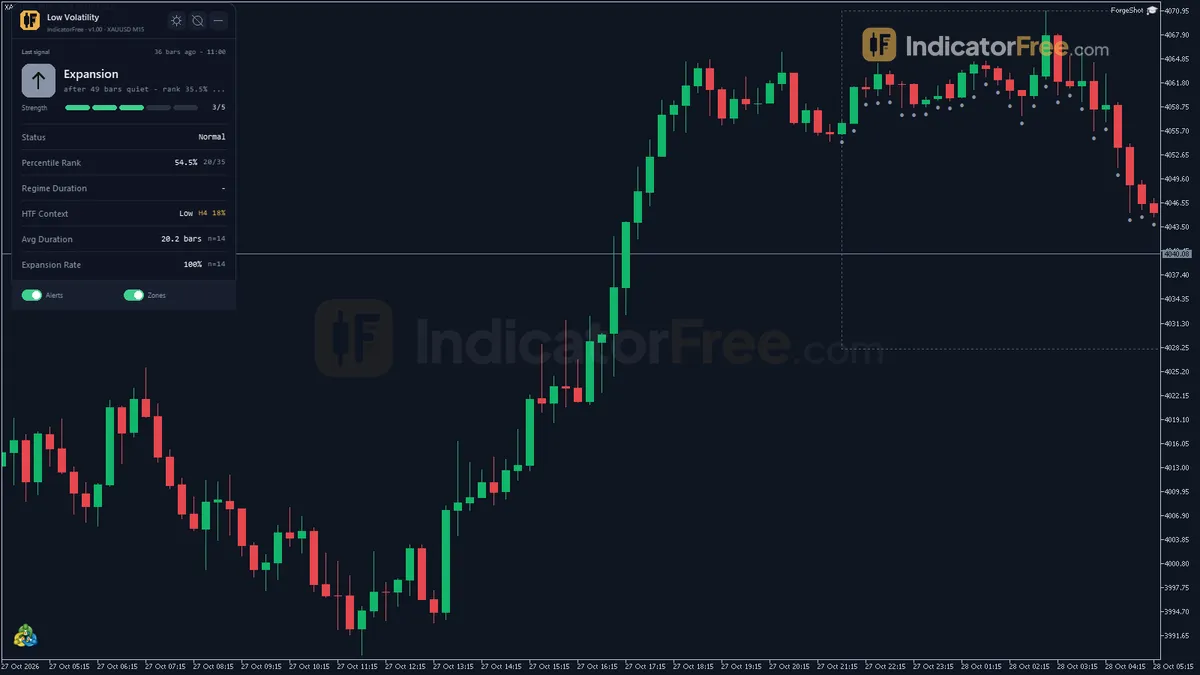
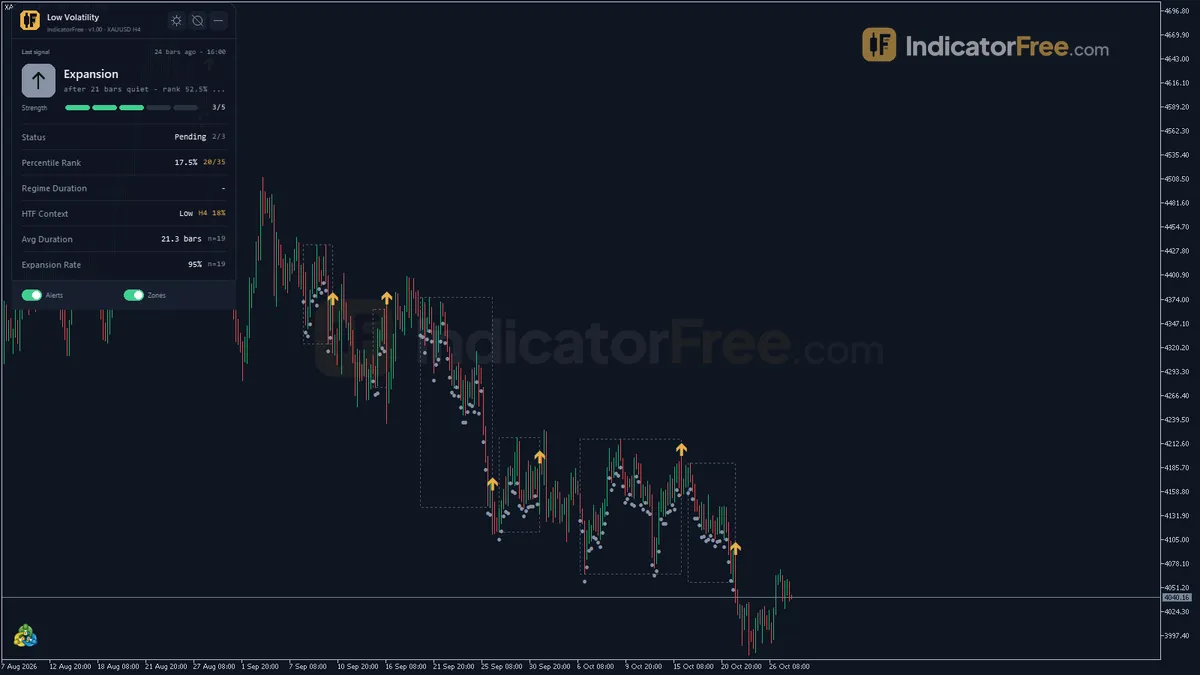
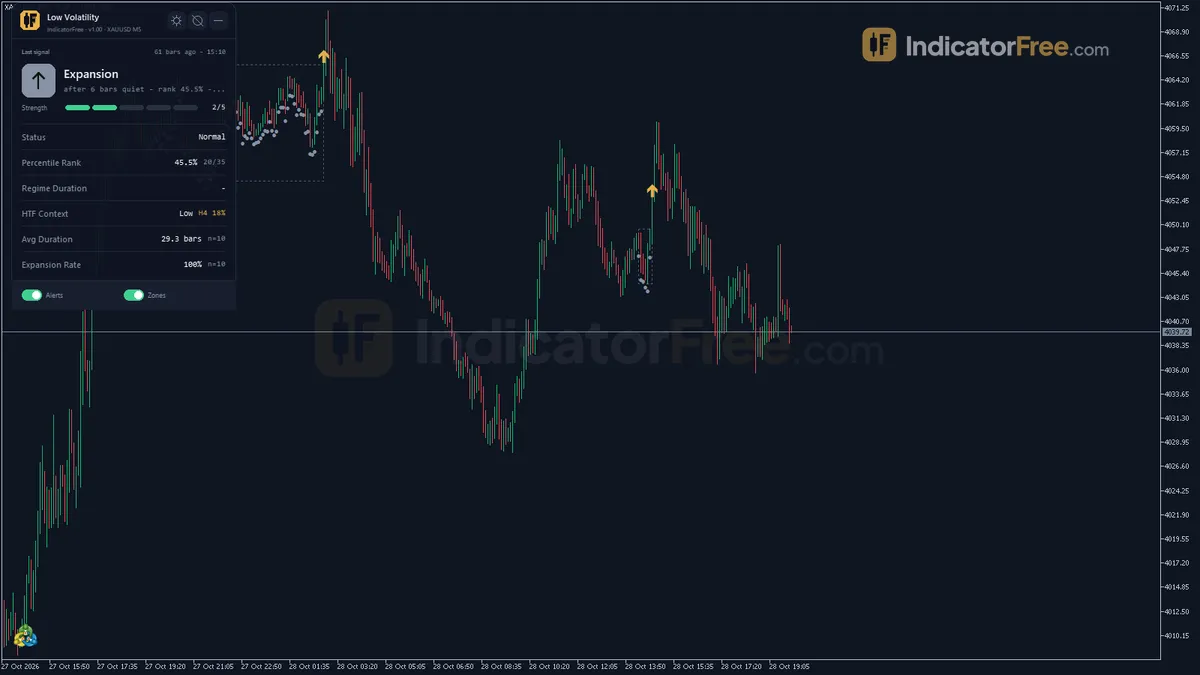
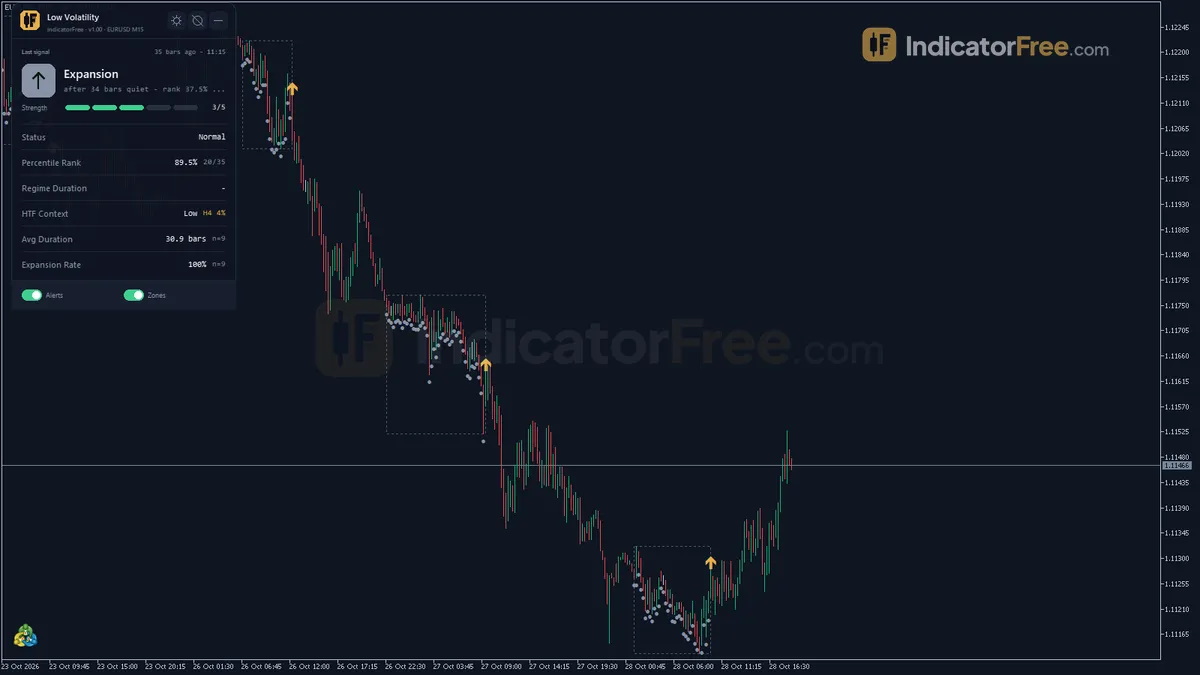
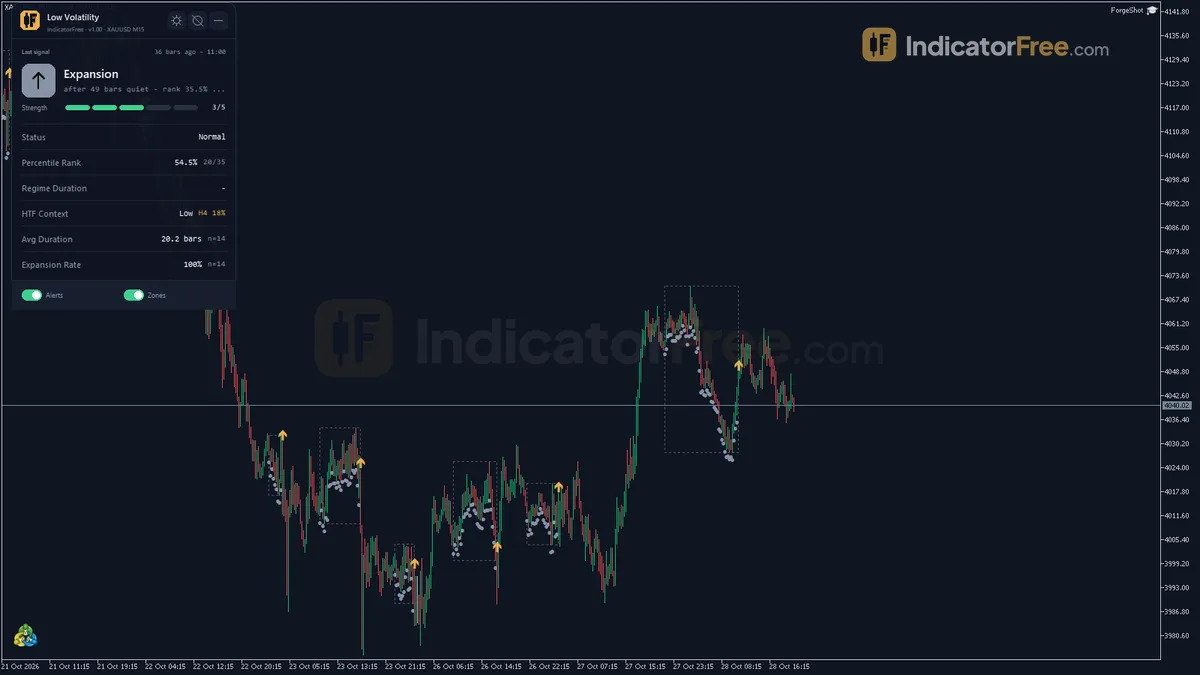
Everything is drawn in the price window, with no subwindow: the Low Vol Bar arrows, the Volatility Expansion arrows, the Low Vol Zone box and a Regime panel.
How the Lab tested it
The Lab ran the indicator on EURUSD M15 from 2026-07-06 to 2026-10-02 with Raw Trading Ltd real ticks on MT5 build 6230. It logged each arrow when it appeared and compared it with the finished history. None of the logged signals moved or disappeared.
Some arrows appeared up to 2 bars after the bar they mark. This is expected, because a streak must last MinRegimeBars bars before it is confirmed. Expect a short lag, not repainting.
What the signal numbers mean for you
The Lab's standard check asks whether price moved 1 ATR in the signal's direction before it moved 1 ATR against it. Both arrows on this tool are non-directional, and the facts do not record which direction the Lab assigned to them. Read the result only as a check on whether the arrows have an edge on direction.
Both arrows are close to a coin flip, so neither one tells you which way price will go. What they do show is that a 1-ATR move almost always came within 20 bars, but during a quiet streak 1 ATR is a short distance, so this shows that price moves, not that a breakout happens. Only 0.7% of all signals saw no 1-ATR move in either direction within 20 bars. That was 1.4% for Low Vol Bar and 0.0% for Volatility Expansion.
After a Volatility Expansion arrow, the median time to a 1-ATR move was 1 bar. After a Low Vol Bar it was 3 bars.
On EURUSD M15 you can expect about 5.5 Low Vol Bar signals and 5.6 Volatility Expansion signals per week.
Who it is for
- Traders who trade breakouts from tight ranges and want those ranges marked for them.
- Traders who reduce size or stand aside when the market goes quiet.
- Traders who want an objective, self-calibrating label for "quiet" instead of judging it by eye.
How it works
- 1Calculates smoothed ATR: first value averages true range, then each blends the previous ATR with the new true range.
ATR = (prev ATR x (period - 1) + True range) / periodInputs: ATRPeriod - 2Ranks each ATR value within the percentile window, with ties counting half.
Rank = (count lower + 0.5 x count equal) / window x 100Inputs: PercentileWindow - 3Low volatility starts when rank falls to the enter level and ends at the exit level. Enough bars confirm it.Inputs: LowEnterThreshold, LowExitThreshold, MinRegimeBars, ShowZoneBox
- 4When a low-volatility streak ends it marks an expansion. Stats show how often range later reaches a multiple of ATR.
Hit if range of look bars / ATR >= ExpansionTargetMultipleInputs: EnableStats, StatsHistoryBars, ExpansionLookBars, ExpansionTargetMultiple - 5Optionally runs the same regime test on a higher timeframe.Inputs: UseHTFContext, HTFPeriod
Specifications
- Platform
- MetaTrader 5
- Version
- 1.00
- Type
- Indicator
- Window
- Main chart
- Draws
- 2 arrows, 1 zone, 1 panel
- Alerts
- popup, push, sound
- Repaints
- No (0 of 141 signals changed)
- Inputs
- 21
- Tested on
- MT5 build 6230 · 2026-10-05
Repaint test
No repaint detected. In a 6 Jul 2026 – 2 Oct 2026 test on EURUSD M15 (Raw Trading Ltd real ticks), 141 signals were logged at bar close and re-read at the end of the test: 0 changed. Arrows appear up to 2 bars after the event they mark.
IndicatorFree — tested 2026-10-05 · MT5 build 6230 · Raw Trading Ltd real ticks. Results come from historical data, not live trading, and do not guarantee future results.
Signal statistics
Over 6 Jul 2026 – 2 Oct 2026 on EURUSD M15, the indicator printed 141 arrows. After 51.1% of them, price moved 1×ATR(14) in the arrow's direction before moving 1×ATR against it (median 2 bars). 0.7% reached neither level within 20 bars.
This measures price movement after the arrow, not a trading result. It includes no spread, commission, stop loss or position sizing.
What it draws
- Arrows (Low Vol Bar) from buffer 0, drawn on the closed bar.
- Arrows (Volatility Expansion) from buffer 1, drawn on the closed bar.
- Rectangles (Low Vol Zone) drawn as chart objects, not buffers — they are not readable by iCustom() in an EA.
- An on-chart panel (Regime); values shown in the panel are not exposed as buffers.
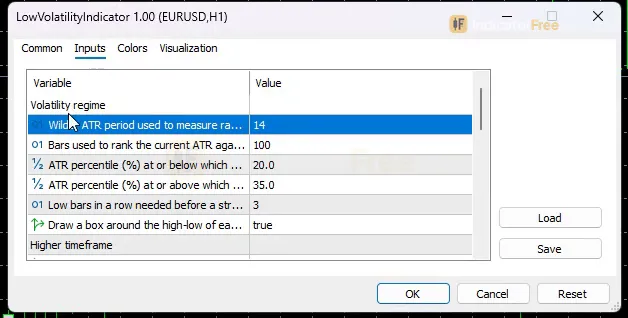
Inputs
| Input | Default | What it does |
|---|---|---|
| ATRPeriod | 14 | Wilder ATR period used to measure raw volatility (5-50) |
| PercentileWindow | 100 | Bars used to rank the current ATR against recent history (50-500) |
| LowEnterThreshold | 20 | ATR percentile (%) at or below which the low-volatility regime starts (5-50) |
| LowExitThreshold | 35 | ATR percentile (%) at or above which the low-volatility regime ends, never below the enter level (max 70) |
| MinRegimeBars | 3 | Low bars in a row needed before a streak is confirmed and drawn (1-20) |
| ShowZoneBox | true | Draw a box around the high-low of each confirmed streak |
| UseHTFContext | true | Show the regime of the last closed bar of a higher timeframe on the panel |
| HTFPeriod | H4 | Timeframe used for the higher timeframe regime |
| EnableStats | true | Show the average streak length and expansion rate on the panel |
| StatsHistoryBars | 1000 | Recent closed bars scanned for finished streaks (200-5000) |
| ExpansionLookBars | 10 | Bars from the expansion bar used to measure the move (3-50) |
| ExpansionTargetMultiple | 2 | Move (high-low) in ATR multiples that counts as a real expansion (1.0-5.0) |
| EnableExpansionAlert | true | Also alert when a confirmed streak ends (Volatility Expansion) |
| AlertPopup | true | Popup alert when a streak is confirmed or ends |
| AlertPush | false | Push notification to the MT5 mobile app |
| AlertSound | false | Play a sound |
| SoundFile | alert.wav | Sound file in the terminal Sounds folder |
| ShowPanel | true | Show the status panel |
| PanelScale | 1 | Panel size multiplier, DPI is applied automatically (0.6-2.0) |
| Theme | Dark | Chart color theme |
| RestoreTheme | true | Restore the original chart colors when the indicator is removed |
How to read it
Install
In MT5, go to File > Open Data Folder > MQL5 > Indicators and copy the .ex5 file there. Then right-click in the Navigator, choose Refresh and drag Low Volatility onto a chart (the Lab tested version 1.00 on build 6230).
Reading the chart
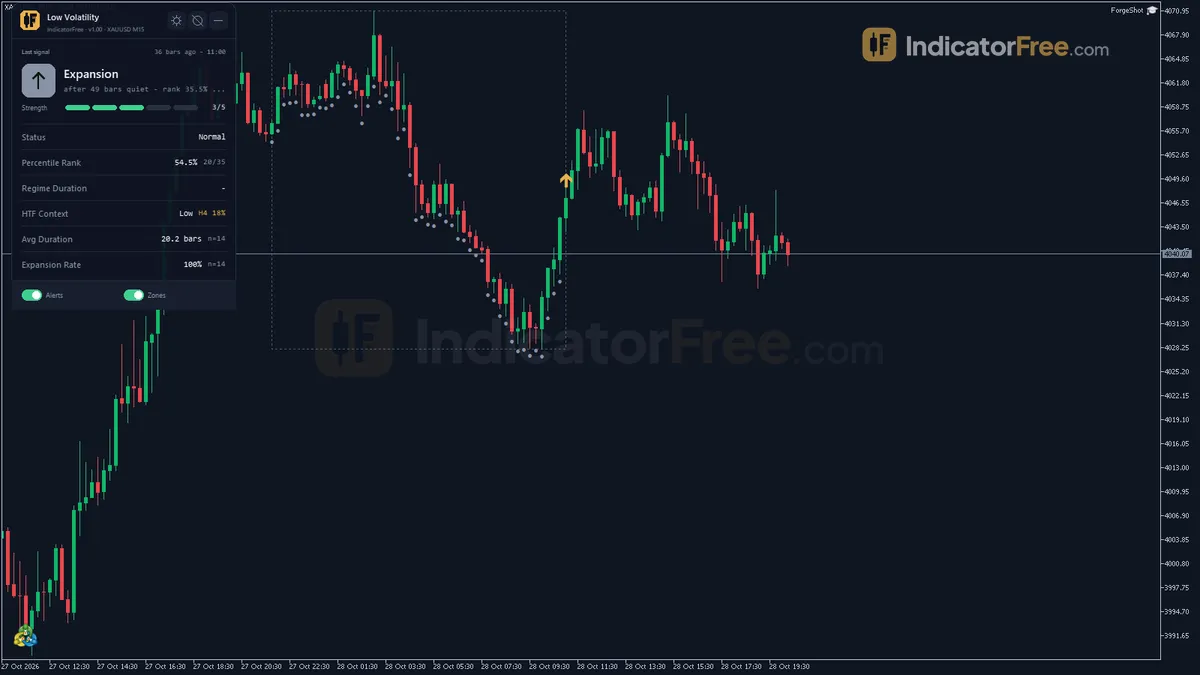
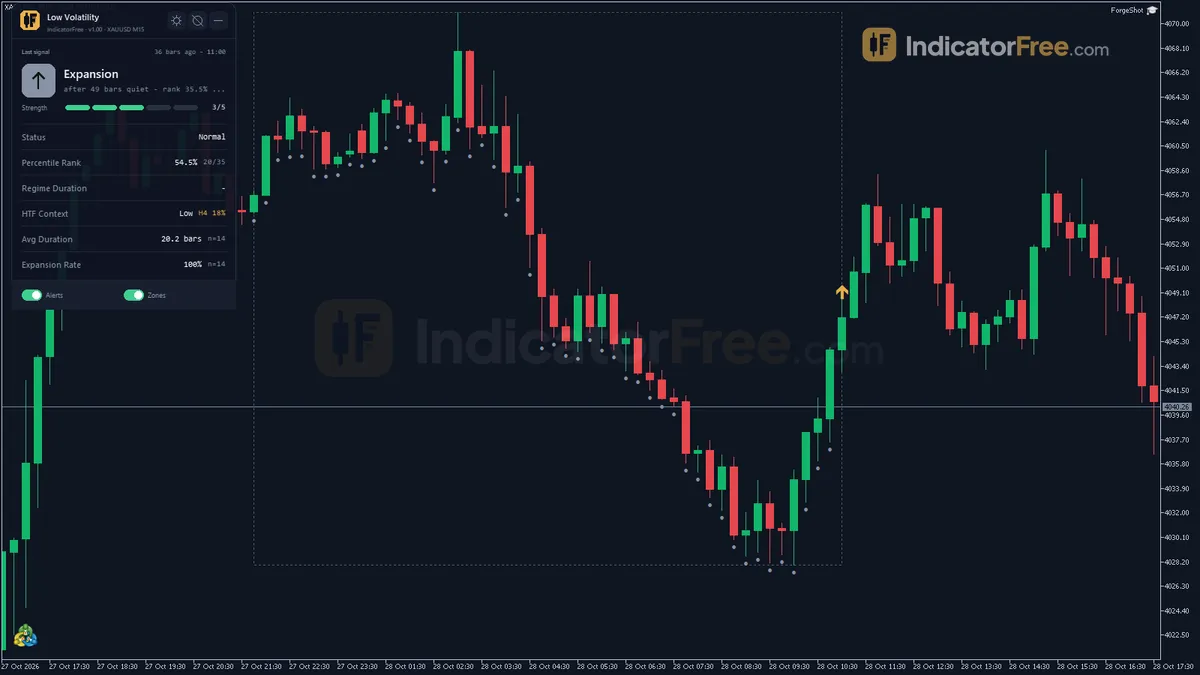
The picture below shows the order in which the drawings appear around one quiet phase.
- Low Vol Bar (arrow): a closed bar inside a confirmed quiet streak. To confirm a streak, the ATR percentile rank must fall to LowEnterThreshold or below and then stay below LowExitThreshold for at least MinRegimeBars bars in a row. Once a streak reaches MinRegimeBars bars, every bar in it gets a Low Vol Bar arrow, including the first ones, which are marked up to MinRegimeBars-1 bars late.
- Low Vol Zone (box): covers the high and low of the streak. It grows while the streak is active and freezes at the expansion bar. Its edges are the range you watch.
- Volatility Expansion (arrow): the first closed bar after a confirmed streak whose ATR rank rises to LowExitThreshold or above. It says that volatility is back. It does not say which way price will move.
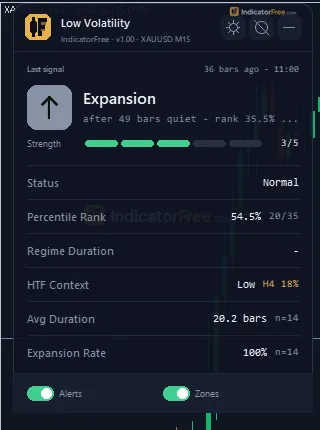
- Regime panel: shows the current regime, the ATR percentile rank, the current streak length and the higher-timeframe regime. It also shows the average streak length and the expansion rate, with the number of streaks behind them.
The misread to avoid
The most common mistake is to treat Volatility Expansion as a buy or sell arrow. The rank can rise on a spike that closes back inside the box. To spot it, check where the expansion bar closed. If the close is still between the box edges, you have a volatility signal with no breakout. A second misread is to treat the most recent Low Vol Bar as "breakout imminent". Streaks can run long, so compare the streak length with the average shown on the panel.
Decision rules
- Low Vol Bar: do not enter on the arrow. Use it to stop taking range-continuation trades and to mark the box edges. If the panel shows the higher-timeframe regime is also Low, the quiet phase covers both timeframes. The Lab has not tested whether that changes streak length.
- Volatility Expansion: trade only in the direction of a candle that closes outside the Low Vol Zone. Skip the signal while price is still inside the box. Because the move often comes within a bar or two, decide your levels before the arrow appears, not after.
Inputs to change first
| Input | Default | Range | What changing it does |
|---|---|---|---|
| ATRPeriod | 14 | 5-50 | Lower values react faster to range changes; higher values make the rank smoother and slower. |
| PercentileWindow | 100 | 50-500 | How much history "low" is judged against. A longer window gives a steadier baseline but adapts more slowly to a new market phase. |
| LowEnterThreshold | 20 | 5-50 | Lower values flag only the quietest phases, so you get fewer, more extreme streaks. |
| LowExitThreshold | 35 | up to 70, never below the enter level | The gap above the enter level is the hysteresis. A wider gap gives longer streaks and fewer expansion arrows. A narrow gap lets the regime flip on and off. |
| MinRegimeBars | 3 | 1-20 | More bars give fewer, firmer streaks but a longer confirmation lag. |
The higher-timeframe line on the panel comes from UseHTFContext and HTFPeriod (default H4). It shows the regime of the last closed higher-timeframe bar.
The panel statistics are controlled by EnableStats, StatsHistoryBars (1000, range 200-5000), ExpansionLookBars (10, range 3-50) and ExpansionTargetMultiple (2, range 1.0-5.0). A finished streak counts as a hit when the high-low range of the ExpansionLookBars bars from the expansion bar, divided by ATR, reaches ExpansionTargetMultiple. These panel figures come from your own chart's history, not from the Lab. Trust them less when the sample size shown is small.
Display inputs: ShowPanel, PanelScale (0.6-2.0, with DPI applied automatically), Theme (Dark) and RestoreTheme, which puts your original chart colors back when you remove the indicator.
Alerts
- AlertPopup (on by default) shows a popup in MT5 when a streak is confirmed and when it ends.
- The alert when a streak ends depends on EnableExpansionAlert. Turn it off if you only want to know when a quiet phase starts.
- AlertPush sends the alert to the MT5 mobile app.
- AlertSound plays SoundFile (default alert.wav) from the terminal's Sounds folder.
Installation
- 1Download LowVolatilityIndicator.ex5 from the button above (Google Drive).
- 2In MetaTrader 5: File → Open Data Folder → MQL5 → Indicators. Copy LowVolatilityIndicator.ex5 there.
- 3Restart MT5 or right-click Indicators in Navigator → Refresh.
- 4Drag Low Volatility onto a chart. For push alerts, enable "Allow push notifications" under Tools → Options → Notifications.
- Tested on MT5 build 6230.
Key terms and guides
- low volatility
- Low volatility means price is moving in small steps: candles are short, the range is narrow, and readings such as the Average True Range sit below their usual level for that market. It describes how far price moves, not which direction it goes.
- Volatility expansion
- Volatility expansion is when a market moves from small, quiet candles to clearly larger ones, so the average distance price travels per candle rises. Traders usually measure it with the Average True Range (ATR).
- Average True Range
- Average True Range (ATR) is a volatility indicator that shows how far price typically moves per candle, gaps included, averaged over a set number of candles. It measures the size of moves, not their direction.
- Every tick based on real ticks
- Every tick based on real ticks is the MT5 Strategy Tester mode that replays the actual bid and ask ticks your broker recorded, with the real changing spread, instead of ticks the tester invents from 1-minute bars.
- Volatility contraction
- Volatility contraction is a stretch where a market's candles and ranges shrink to unusually small sizes. It is often measured as Bollinger Band width or ATR at a multi-candle low, and a wider move in either direction tends to follow.
- Symbol
- A symbol is the short code a trading platform uses to name one tradable market, such as EURUSD for the euro against the US dollar or XAUUSD for gold. Every quote, chart and order is tied to exactly one symbol.
More on this subject: Volatility & ranges guide, terms and tools
User reviews
No reviews yet. Members who download the tool can review it here.
Sign in and download the tool to review it.
Build a checklist with it
Low Volatility does one job on the chart: risk / volatility. Put it on the same chart as the tools below and the IndicatorFree panels merge into one checklist card, ordered trend, zone, signal, risk.
- Trend / contextDMIAdds the trend side: which way the market leans before you act on Low Volatility.
- Entry signalApex PinchAdds the entry signal: the moment to act once Low Volatility has set the scene.
The Lab has not tested these combinations. Each tool is tested on its own; the card only lines up what each one says. Free members get 2 new tools a day. If one has to wait until tomorrow, install BlackBox to raise the limit to 5 a day (20 on a live account).
FAQ
Does Low Volatility repaint?
No repaint detected. In a 6 Jul 2026 – 2 Oct 2026 test on EURUSD M15 (Raw Trading Ltd real ticks), 141 signals were logged at bar close and re-read at the end of the test: 0 changed. Arrows appear up to 2 bars after the event they mark.
Can I use Low Volatility in an EA?
Yes. Read buffer 0 (Low Vol Bar) with iCustom() on bar 1 — the last closed bar.
Why can’t my EA read the zones?
Zones and the panel are chart objects, not indicator buffers, so iCustom() does not return them.
How do I get alerts on my phone?
Enter your MetaQuotes ID under Tools → Options → Notifications, tick "Enable push notifications", and keep the push alert input on.
Does it work on other pairs?
Tested on EURUSD only; other symbols not tested.
Why do Low Vol Bar arrows show up on bars that already closed a few bars ago?
A streak is confirmed only after the ATR rank has stayed low for MinRegimeBars bars in a row (default 3). At that point every bar of the streak gets an arrow, including the first ones, so those arrows are added up to MinRegimeBars-1 bars late. Lower MinRegimeBars if you want a shorter delay, but expect more short streaks that end quickly.
What happens if I run it on an H4 chart and leave HTFPeriod on H4?
The higher-timeframe line then tests the last closed bar of the chart's own timeframe, so it adds no wider context. Set HTFPeriod to a timeframe above the chart.
Does it work on gold, indices or crypto?
The ATR percentile rank adjusts to each symbol's own history, so it runs on any chart. The Lab only tested it on EURUSD, though, so check the panel's expansion rate and sample size on your market before you rely on it.
Why is the expansion rate on the panel different from the Lab's numbers?
They use different data and a different rule. The panel counts a hit when the range reaches ExpansionTargetMultiple ATR within ExpansionLookBars bars (2 ATR in 10 bars by default) on your chart's history. The Lab checked whether price reached 1 ATR in the signal's direction before 1 ATR against it, on EURUSD M15 only.
Changelog
- 1.00Initial release: self-calibrating ATR percentile rank regime classifier (Low / Normal) with two-level hysteresis and minimum-bar confirmation filter. · 2026-10-09
Final verdict
The Lab's judgement
Low Volatility does the job it claims. It marks quiet phases and their end with arrows that held up in the repaint test, and it gives you a box you can trade around. On EURUSD M15 it produced about 11.1 signals a week in total, which you can follow without being flooded.
The panel shows the typical streak length and expansion rate measured on your own chart, with the sample size next to them.
Its limit is direction. Neither arrow beat a coin flip on direction in the Lab's test, so on its own it is a risk and timing filter, not an entry system.
Limits you should know
- The Lab tested one symbol and one timeframe: EURUSD M15. Every other market and timeframe is untested.
- It gives no direction, no stop and no target. Those have to come from the box edges or from your own method.
- Arrows appear after confirmation, so the start of a streak is always marked in hindsight.
- "Low" is relative to the PercentileWindow. A streak flagged during a volatile month can still be wide in pips.
Use it or skip it
The comparison below helps you decide whether the tool fits your trading.
- –You trade breakouts and want quiet ranges boxed automatically
- –You cut size or stand aside in dead markets
- –You already have a method for choosing direction
- –You want one alert when a quiet phase starts and one when it ends
- –You want arrows that tell you to buy or sell
- –You need the exact first bar of a quiet phase with no lag
- –You fade range edges and need a warning before the range breaks; the expansion arrow fires only after the rank has alrea
- –You will not check where the expansion bar closed
Settings to start with
On M15, start with the defaults, because that is the setup the Lab tested. For M5, try MinRegimeBars 5 and PercentileWindow 200 to filter out very short quiet stretches. For H4, try PercentileWindow 50 so the baseline does not reach too far back, and set HTFPeriod higher than the chart, for example D1, because the default H4 context is the chart's own timeframe there. These are not tested by the Lab, so compare them with the defaults on your own chart. If expansion arrows keep firing on bars that close inside the box, widen the gap by raising LowExitThreshold, for example to 40. That is also untested.
An idea to try with it
An idea the Lab has not tested: pair it with Average Daily Range to see whether the day still has room to move when a Volatility Expansion arrow fires.