









Volatility contraction
Also called Volatility squeeze, Bollinger squeeze, Range contraction, VCP
Volatility contraction is a stretch where a market's candles and ranges shrink to unusually small sizes. It is often measured as Bollinger Band width or ATR at a multi-candle low, and a wider move in either direction tends to follow.
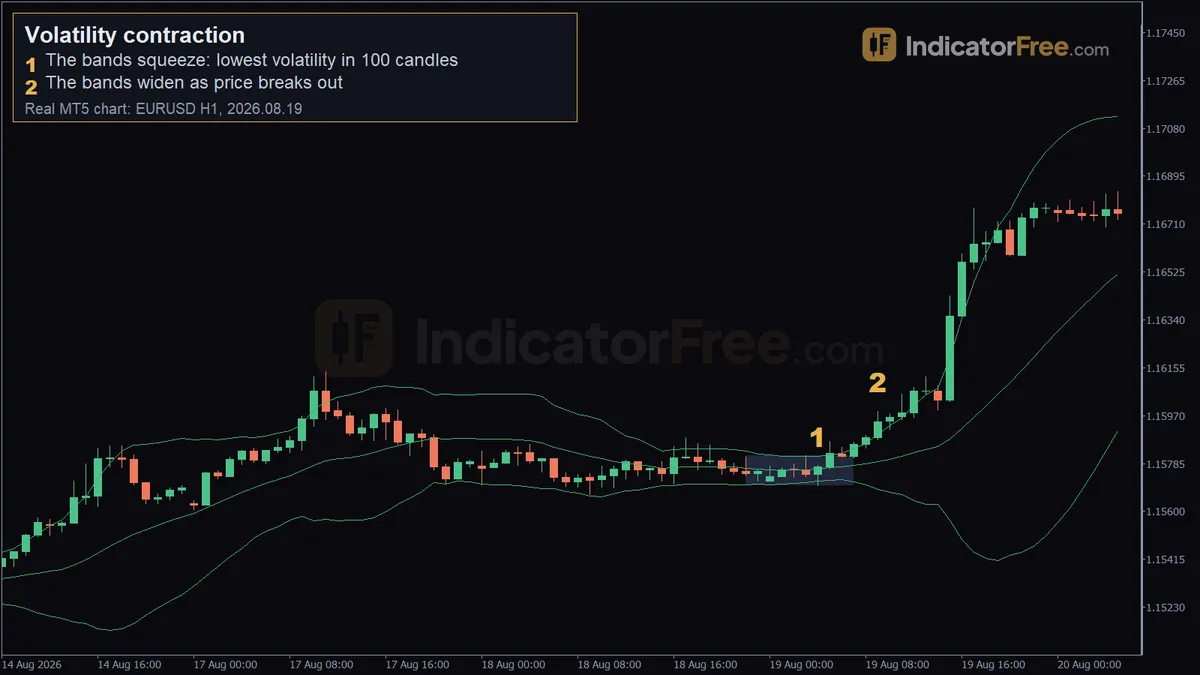
Quiet markets rarely stay quiet. A volatility contraction tells you a bigger move may be coming. It does not tell you which way, so the money is made or lost on how you wait for the break. The extreme case is a squeeze: band width at its lowest in about 100 candles.
How to spot volatility contraction: a 7-point checklist
- Find a measured low. Bollinger Band width or the Average True Range (ATR, the average size of recent candles) is at its lowest in about 100 candles. If it only looks quiet to you, that is not enough.
- Check that the candles shrink. The latest candles have clearly smaller bodies and wicks than the ones before them.
- Mark the range. You can draw a tight high and a tight low around the quiet candles.
- Look for an earlier wide move. A contraction after a trend or a sharp swing has more energy behind it than one inside a range that has been dead for weeks.
- Wait for a close. A candle must close outside the tight range or outside the bands. A wick poking through does not count.
- See the bands widen. On the breakout, the band width or ATR starts rising again. That is the expansion confirming the move.
- Clear the calendar. No major news is due inside the next few candles.
The chart below shows the shape you are looking for: wide candles, then a run of small ones in a tight box, then a close outside the box.
When a contraction is weak, broken or worth trading
A contraction is weak when the quiet comes from the clock, not from the market. The late session and the hours before a weekend are calm every day. A squeeze there tells you little.
It is also weak when a big scheduled news release is due inside the range. The first spike often breaks out both sides of the box before it picks a direction.
The setup is broken when price closes back inside the range soon after the breakout candle. Treat that as a failed break, often called a head fake. Do not add to the trade. Exit or stand aside.
A common misread is treating any close outside the bands as a breakout. A single close outside is ordinary, as the Lab counts further down show. What matters is the close outside after a measured low in width.
| Pros | Cons |
|---|---|
| Clear, measurable trigger (width at a 100-candle low) | Gives no direction until the break |
| Tight stop beyond the box | Fake breaks are common |
| Squeezes occur regularly on EURUSD and XAUUSD, 1-hour and 4-hour (Lab counts below) | Can stay quiet for many candles |
| Easy to combine with trend direction | News can break both sides at once |
The EURUSD squeeze of 19 August 2026, marker by marker
The chart at the top of this page is a past example on the EURUSD 1-hour chart, with Bollinger Bands (20, 2). It shows what happened, not what will happen next time.
- Marker 1, 2026.08.19 04:00, price 1.15777. The bands were 10 pips wide, the narrowest in 100 candles. That is checklist point 1: a measured low, not a guess.
- Marker 2, 2026.08.19 09:00, price 1.15987. Five hours later the bands were twice as wide, about 20 pips, and price was breaking out upward. That is checklist point 6: the bands widening as price breaks out.
The two marker prices are single snapshots. They are not the high and low of the quiet candles, and this example does not record those box edges. By 09:00 price had moved 100 pips, so the 09:00 marker shows when the expansion was confirmed, not where the move started or ended. Do not use the markers as entry and stop levels. To trade a squeeze like this one, use the rules in the next section: mark the high and low of the quiet candles, wait for a close outside them and set the stop beyond the box.
Notice the gap in time. The squeeze did not resolve on the next candle. Waiting for the expansion kept you out of the dull hours in between.
Trading the breakout from a volatility contraction
Entry, stop and size from the squeeze range
Buy on the first candle that closes above the high of the quiet candles, as the bands start to widen.
The tight range gives you a natural stop: just outside the far side of the box. For a buy, place it below the low of the quiet candles, plus a small buffer for spread and noise. For a bearish break, mirror every rule: close below the box and lower band, sell, stop above the box plus the same buffer.
The size then follows from the stop in three steps. First, find your stop distance in pips by measuring from your actual entry price, the close of the breakout candle, to the stop. If that candle closed near the box high, the distance is roughly the box width plus the buffer. If it closed far beyond the box, the distance and the risk are larger. Second, your account balance times the percentage you are willing to lose is your risk in money. Third, multiply the stop distance by the pip value of one lot, divide your money risk by the result, and you have your lot size. The figures in this step are an illustrative example. Say the box is 20 pips tall, the breakout candle closes right at the box high, you add a 5-pip buffer, your account is $10,000 and you risk 1%. On EURUSD, one standard lot (100,000 units) is worth $10 per pip.
The rule is simple: a tighter box gives a smaller stop, so you can trade a larger size for the same risk. If the box is so tight that your stop sits inside normal spread noise, widen the buffer and cut the size.
How often a squeeze appears: Lab counts
The IndicatorFree Lab counted 12 months of broker demo data, 2025-10-02 to 2026-10-02. This is past data, not a forecast.
| Market and chart | New 100-candle low in band width | Closes outside bands (20, 2) | Closes outside bands (20, 2.5) |
|---|---|---|---|
| EURUSD 1-hour | 4.5 per month | 13.2% | 5% |
| EURUSD 4-hour | 0.9 per month | 13.1% | 3.7% |
| XAUUSD 1-hour | 4.7 per month | 12.3% | 4.3% |
| XAUUSD 4-hour | 1.4 per month | 13% | 4.6% |
Two decision rules follow from this. On the 1-hour chart, squeezes came about once a week, so you can afford to skip the ones that fail the checklist. On the 4-hour chart they were rarer, so each one deserves a closer look. And because more than one candle in ten closed outside the (20, 2) bands, a close outside the bands on its own is not a signal. It only matters after a squeeze.
Practical tips for trading squeezes
- Trade the break in the direction of the higher-timeframe trend first. Treat counter-trend breaks as optional.
- Set alerts at the box high and low instead of watching quiet candles.
- After a failed break, keep alerts on both sides of the box. Only a new close outside it, in either direction, counts as a new signal.
- Note the squeeze width in pips in your journal. Over time you will see which widths were worth trading on your pair.
- Do not move your stop inside the box once you are in. The box is the reason for the trade.
FAQ
What is the volatility contraction pattern (VCP) and does it work in forex?
VCP comes from stock trading: a series of pullbacks, each shallower than the last, before a breakout to new highs. In forex, the same idea shows up as swings that get smaller into a tight range. Use the same checklist: a measured low, then a close outside.
Is ATR or Bollinger Band width better for spotting a squeeze?
Both measure quiet from different angles. Band width tracks how tightly closes sit around their 20-candle average. ATR tracks the size of each candle, wicks included. Band width is what the Lab counted above, and ATR is handy for sizing the stop buffer. Pick one for spotting squeezes and stick with it, so your 100-candle lows stay comparable.
Should I enter before the breakout to get a better price?
Only if you accept that you are guessing the direction. If you enter early, use half your normal size and keep the stop on the far side of the box.