Bollinger Bands
Also called BB
Bollinger Bands are a volatility indicator on MT5 that plots a moving average with two bands above and below it, widening and narrowing as price volatility changes.
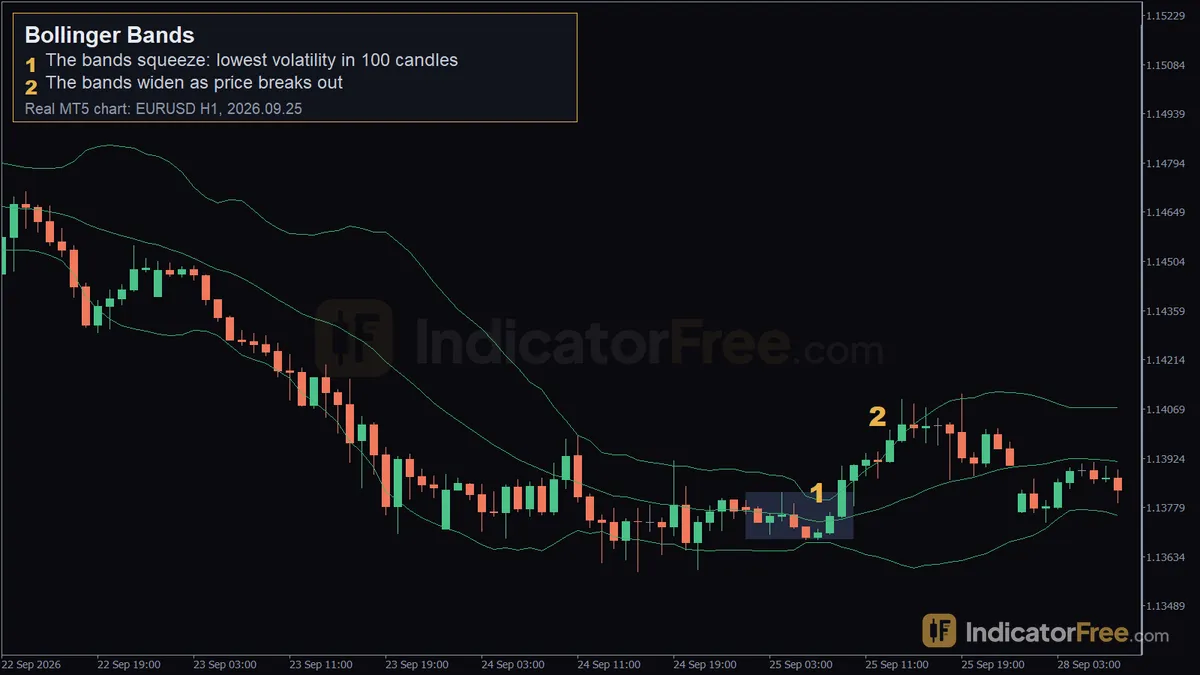
Bollinger Bands are a volatility indicator plotted directly on the price chart: a moving average in the middle with two bands above and below it that widen when price swings more and narrow when it calms down. Traders use them to see when a market is quiet or stretched, and to time entries around squeezes, breakouts and pullbacks.
Anatomy of Bollinger Bands
Three lines make up the indicator:
- Middle band - a simple moving average of Close price, 20 periods by default on MT5.
- Upper band - the middle band plus a set number of standard deviations of price (2 by default), moving away from the average as volatility rises.
- Lower band - the same distance below the middle band.
- Band width - the gap between the upper and lower band. It is not a separate line on the default chart, but it is what you are really watching: it shrinks in a squeeze and expands in a breakout.
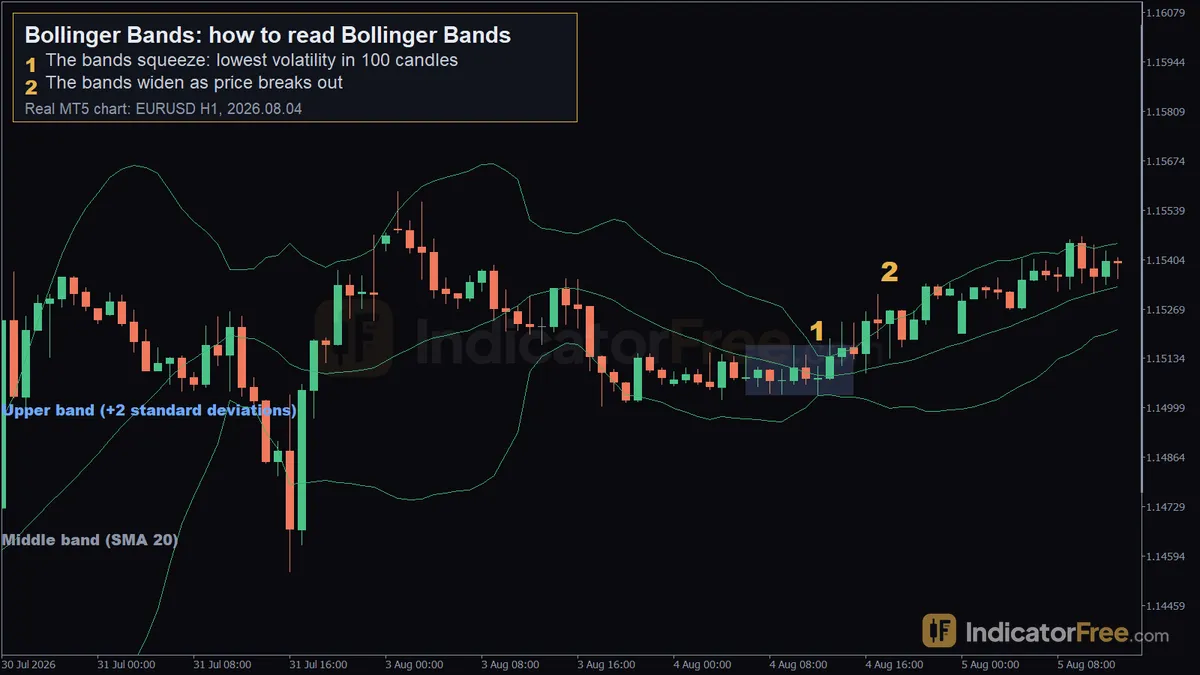
Bollinger Bands, how to read Bollinger Bands: real EURUSD H1 MT5 chart (2026-08-04).
On that EURUSD H1 chart, the bands were 11 pips wide at 2026.08.04 12:00 - the narrowest point in the previous 100 candles - then doubled in width by 18:00 as price moved 27 pips. The same pattern shows in the chart at the top of this page: on 2026.09.25 the bands narrowed to 13 pips at 07:00 (again the narrowest in 100 candles) before widening to cover a 41-pip move by 12:00.
MT5 inputs for Bollinger Bands
| Input | MT5 default | What changing it does |
|---|---|---|
| Period | 20 | Shorter periods make the middle band and the bands react faster to new price swings; longer periods smooth them out and delay squeeze and breakout signals. |
| Shift | 0 | Shifts the whole indicator left or right on the chart. Left at 0 by almost everyone. |
| Deviations | 2 | A wider deviation means wider bands and fewer closes outside them; a narrower deviation means tighter bands and more touches. |
| Applied to | Close | Changes which price (Close, Open, High, Low, Median, Typical, Weighted) feeds the average and the standard-deviation calculation. |
These four inputs are all MT5 gives you for the built-in Bollinger Bands indicator.
Signals Bollinger Bands gives
//The squeeze
When band width shrinks to a new low for the recent past, volatility has dried up. A squeeze on its own does not say which way price will go next, only that it has been unusually quiet.
//The breakout
When the bands widen quickly after a squeeze and price pushes through one side, volatility is picking back up. This is normally read together with the direction price is actually moving, not on its own.
//Walking the band
In a strong trend, closes can sit on or outside the upper band (uptrend) or lower band (downtrend) for several candles in a row. This is not automatically a reversal signal - it is the bands reporting a trend that is still stretching.
//The stretch back to the middle band
When price pokes outside a band and then pulls back toward the middle band (the moving average), some traders read that as a snap-back move inside a ranging market.
When Bollinger Bands works well, and when to avoid it
Works well:
- In ranging markets, where price oscillates between the two bands.
- After a genuine squeeze, to flag that a bigger move may be close.
- In a trending market, to see whether the trend is still stretching (walking the band) or losing steam.
- Alongside a momentum or volume tool that can confirm the direction of a breakout.
Avoid or treat with caution:
- Around scheduled news releases, when a single spike can pierce both bands without any real continuation.
- On very short timeframes, where band touches happen constantly and carry little meaning on their own.
- Treating every touch of a band as a reversal signal - in a trend, price can walk the band for a long stretch.
- Right after a squeeze with no other confirmation of direction, since the breakout can go either way.
Pros and cons
| Pros | Cons |
|---|---|
| Built into MT5, no installation needed | Does not tell you the direction of the next move |
| Adjusts to current volatility automatically | Lags, because it is based on a moving average |
| Reads the same way on any symbol or timeframe | Squeeze and breakout calls need judgement, not a fixed rule |
| Simple to read at a glance | Band touches mean opposite things in a range versus a trend |
Practical setups
//Setup: squeeze breakout
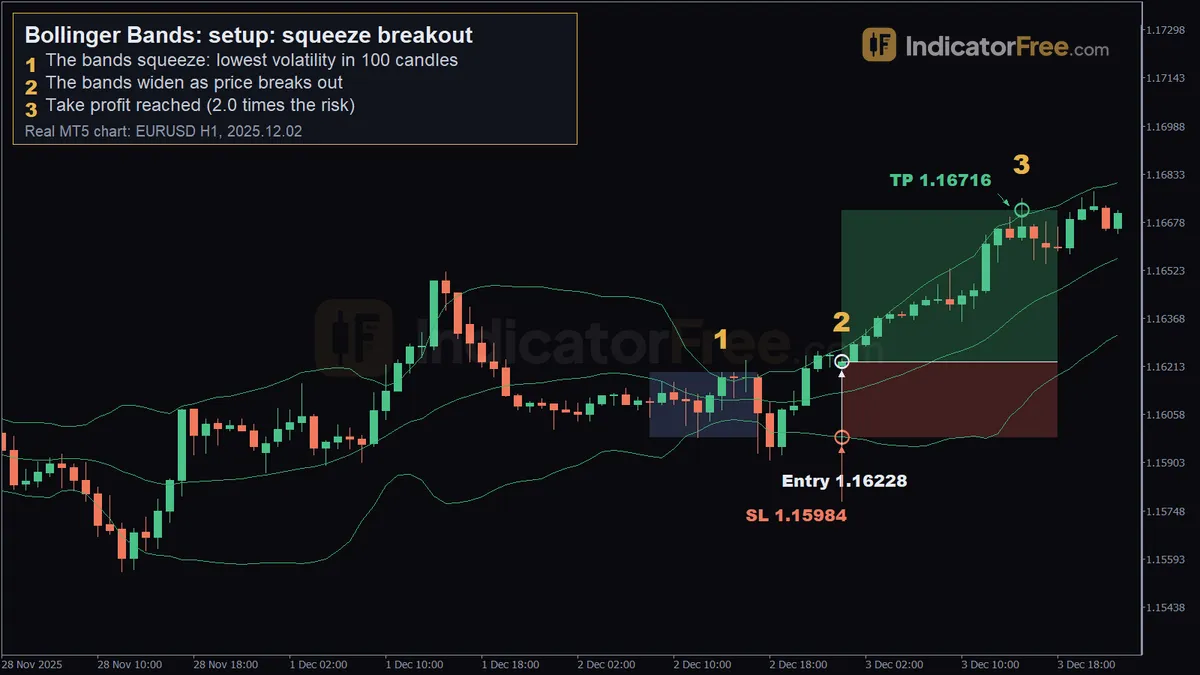
Bollinger Bands, setup: squeeze breakout: real EURUSD H1 MT5 chart (2025-12-02).
On EURUSD H1, the bands narrowed to 14 pips wide at 2025.12.02 14:00 - the narrowest in 100 candles. By 2025.12.03 00:00 they had doubled in width and price had moved 35 pips.
- Entry trigger: buy at 1.16228 as the bands widen out of the squeeze, 2025.12.03 00:00.
- Stop loss: 1.15984, 24 pips of risk.
- Exit: take profit at 1.16716 (2.0R), reached 2025.12.03 15:00.
This is a past example on one EURUSD chart, not a forecast of how the next squeeze will resolve.
//Setup: back to the middle band
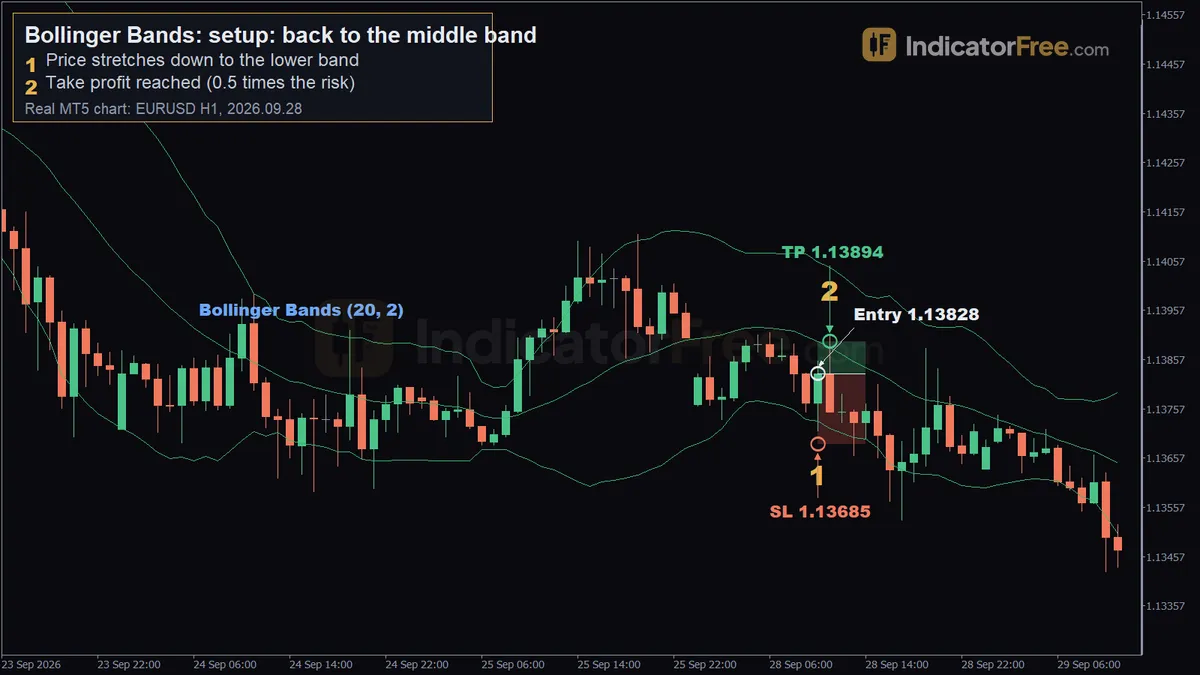
Bollinger Bands, setup: back to the middle band: real EURUSD H1 MT5 chart (2026-09-28).
On EURUSD H1, the low at 2026.09.28 10:00 reached 1.13712, touching the lower band at 1.13733 (0.1% under the 20-period SMA). By 11:00 price was back near the SMA at 1.13881, a 20-pip move.
- Entry trigger: buy at 1.13828 as price stretches down to the lower band, 2026.09.28 10:00.
- Stop loss: 1.13685, 14 pips of risk.
- Exit: take profit at 1.13894 (0.5R), reached 2026.09.28 11:00.
Again, one historical example - a stretch back to the middle band does not happen on every touch.
//Setup: riding the band in a trend
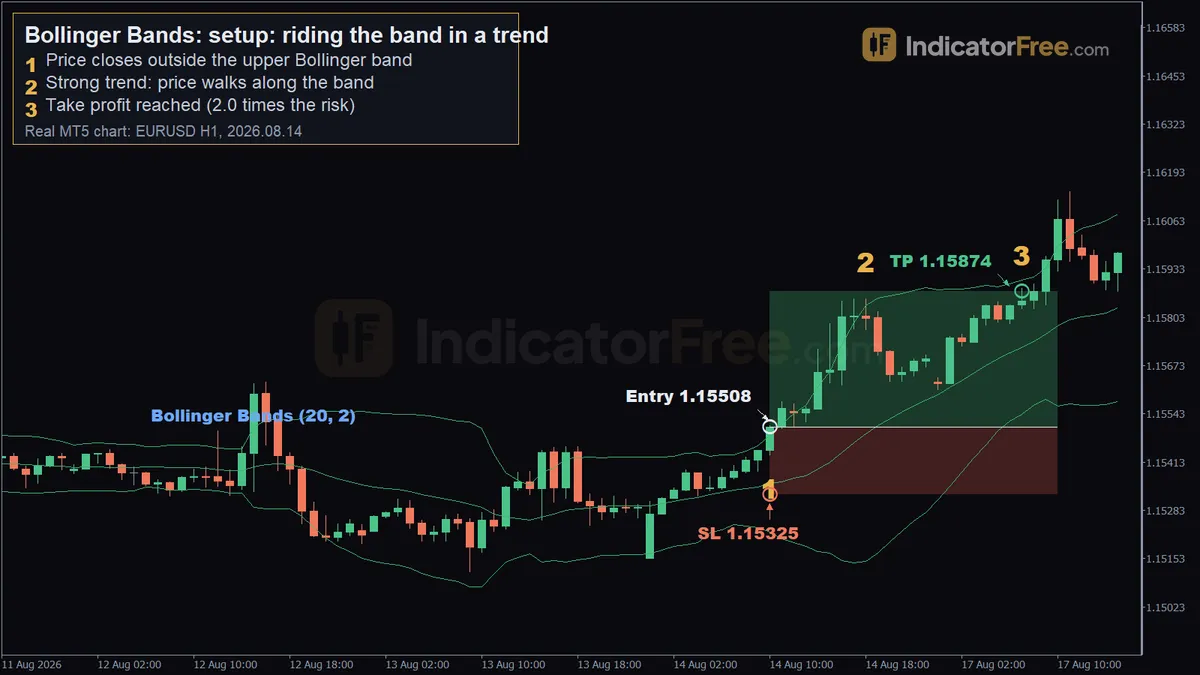
Bollinger Bands, setup: riding the band in a trend: real EURUSD H1 MT5 chart (2026-08-14).
On EURUSD H1, price closed at 1.15508 on 2026.08.14 10:00, above the upper band at 1.15485. Price then rose 35 pips over the next 15 candles, walking along the upper band.
- Entry trigger: buy as the candle closes outside the upper band, 1.15508 on 2026.08.14 10:00.
- Stop loss: 1.15325, 18 pips of risk.
- Exit: take profit at 1.15874 (2.0R), reached 2026.08.17 07:00.
This setup treats a close outside the band as trend continuation - the opposite read from the mean-reversion setup above. Which one applies depends on whether the market is trending or ranging at the time.
Choosing settings by trading style
| Trading style | Period | Deviations | Why |
|---|---|---|---|
| Scalping (M1-M5) | 10-14 | 1.5-2 | Tighter bands react faster to short bursts of volatility |
| Day trading (M15-H1) | 20 (MT5 default) | 2 | The default most charts and other traders are already looking at |
| Swing trading (H4-D1) | 20-50 | 2-2.5 | Smoother bands, fewer squeezes triggered by ordinary noise |
Raising the deviation from 2 to 2.5 does not change the bands' shape, only how far out they sit, and how often price closes beyond them.
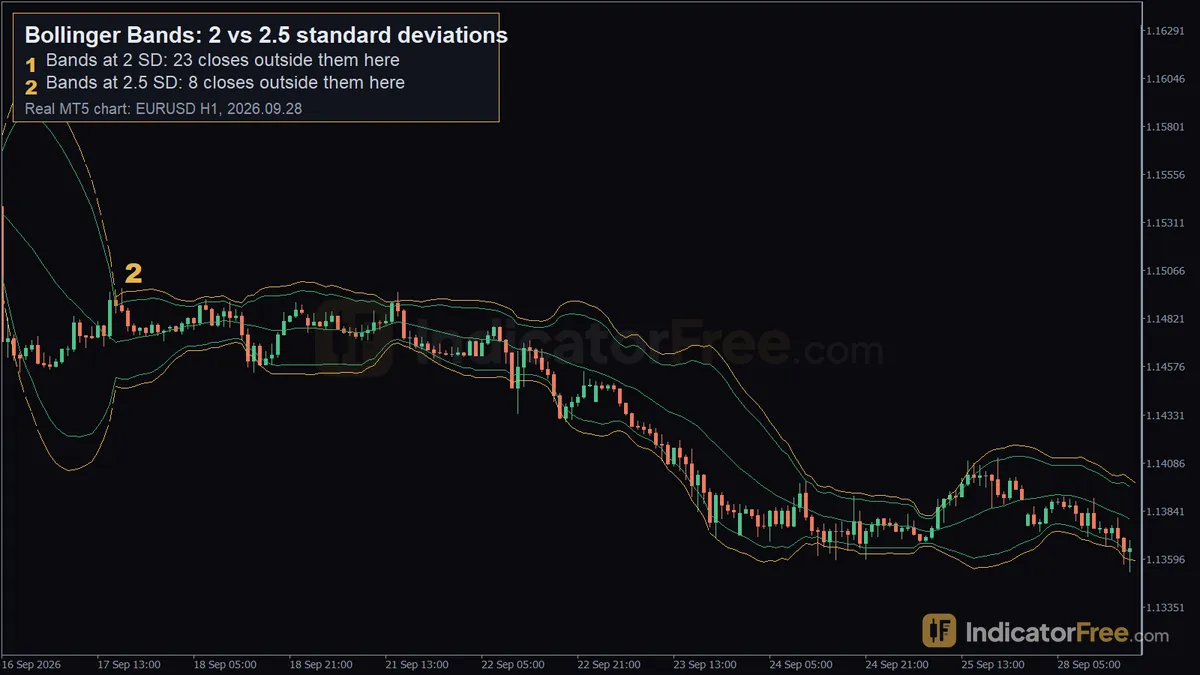
Bollinger Bands, 2 vs 2.5 standard deviations: real EURUSD H1 MT5 chart (2026-09-28).
On EURUSD H1 between 2026.09.16 19:00 and 2026.09.28 17:00 (190 candles), bands at 2 standard deviations were closed beyond 23 times; at 2.5 standard deviations, only 8 times. Wider bands mean fewer, later signals.
Gold (XAUUSD) and major FX pairs behave at a similar pace in relative terms - the Lab measurements below put close-to-band frequency within a couple of points of each other across symbols - but gold moves in much larger absolute price amounts, so its bands look far wider in raw price terms even with the same 20/2 settings. There is no need for a different deviation just because the symbol is gold rather than a currency pair.
Combining Bollinger Bands with another tool
Bollinger Bands measures volatility and distance from an average, not momentum. Pairing it with an oscillator such as RSI adds a second read: a close outside the upper band alongside a falling RSI points more toward exhaustion, while a close outside the upper band with RSI still rising fits better with the walking-the-band continuation setup above. Neither tool confirms the other automatically - they measure two different things in the same price action, read side by side.
What the Lab measured
The IndicatorFree Lab measured Bollinger Bands (20, 2) and (20, 2.5) over 12 months of past broker demo data on MT5, across EURUSD and XAUUSD on H1 and H4. This is past data, not a forecast.
| Symbol / timeframe | Closes outside (20, 2) | Closes outside (20, 2.5) | Squeezes (100-candle low) per month |
|---|---|---|---|
| EURUSD H1 | 13.2% | 5% | 4.5 |
| EURUSD H4 | 13.1% | 3.7% | 0.9 |
| XAUUSD H1 | 12.3% | 4.3% | 4.7 |
| XAUUSD H4 | 13% | 4.6% | 1.4 |
Two patterns stand out in this past data: raising the deviation from 2 to 2.5 roughly cuts the frequency of closes outside the bands by more than half on every symbol and timeframe tested, and H4 squeezes are far rarer than H1 squeezes - under one a month on EURUSD H4, against more than four a month on EURUSD H1.
Practical tips
- Read the squeeze and the breakout together - a squeeze on its own only says "wait", it does not say which way.
- Measure band width in pips or points on the timeframe you trade before calling something a squeeze; a narrow band on H4 looks very different from a narrow band on M15.
- On the mean-reversion setup, keep stops beyond the band itself - price can stretch further than expected before turning back.
- When walking the band in a trend, do not treat every close outside the band as a reason to exit or fade the move.
- Match the deviation to how often you want signals: 2.5 gives fewer, later alerts than the MT5 default of 2.
- Check the broader trend or range context before picking between the squeeze-breakout setup and the back-to-the-middle setup - they call for opposite reads of the same band touch.
//Quick checklist
- Is the band width unusually narrow (a squeeze) or has it just widened (a breakout)?
- Is price closing outside a band because of a trend (walking the band) or a stretch likely to snap back?
- Where does the stop go - beyond the band, not just beyond the entry candle?
- Does another tool (RSI, volume, a higher timeframe) agree with the read?
Not to be confused with Keltner Channels
Keltner Channels look similar - a moving average with two lines around it - but they are built from ATR (average true range), not standard deviation. Bollinger Bands widen and narrow based on how far closes are scattered from the average; Keltner Channels widen and narrow based on the average size of each candle's range. The two can disagree during a slow grind with occasional large wicks, since that affects standard deviation and ATR differently.
FAQ
Does Bollinger Bands work on stocks, not just forex and gold? The calculation is the same on any symbol MT5 can chart - a moving average plus a standard-deviation band. The Lab numbers on this page come from EURUSD and XAUUSD testing, not stocks, so treat the exact percentages as specific to those symbols.
What is Bollinger Bandwidth? Bandwidth is a separate line, usually plotted below the chart, that tracks the distance between the upper and lower band over time. It turns "is this a squeeze" into a single number you can watch rise and fall, instead of eyeballing the gap between the bands.