Moving average
Also called MA
A moving average is a line plotted from the average price over a set number of past candles, used to smooth price action and show the direction of the trend.
A moving average is a line drawn from the average price over a set number of past candles, redrawn on every new candle so it tracks the market as it moves. Traders use it to smooth out candle-to-candle noise, read the slope of the trend, and mark a level where price tends to pull back to or bounce from.
The moving average formula and what the line shows
SMA = (P1 + P2 + ... + Pn) / n
n is the period — how many candles are averaged — and P is each candle's close. On a 50-period SMA on an hourly chart, each new candle drops the oldest close and adds the newest one, so the line shifts: a rising line means closes have been climbing over that lookback, a falling line means they have been dropping, and a flat, wandering line means price has been going nowhere.
Other versions of this calculation weight recent candles more heavily — the exponential moving average, weighted moving average and Hull moving average each do this differently, and each has its own entry on this site. The math changes, but the job is the same: turn a jumpy price series into one line you can read at a glance.
Reading the moving average on the chart
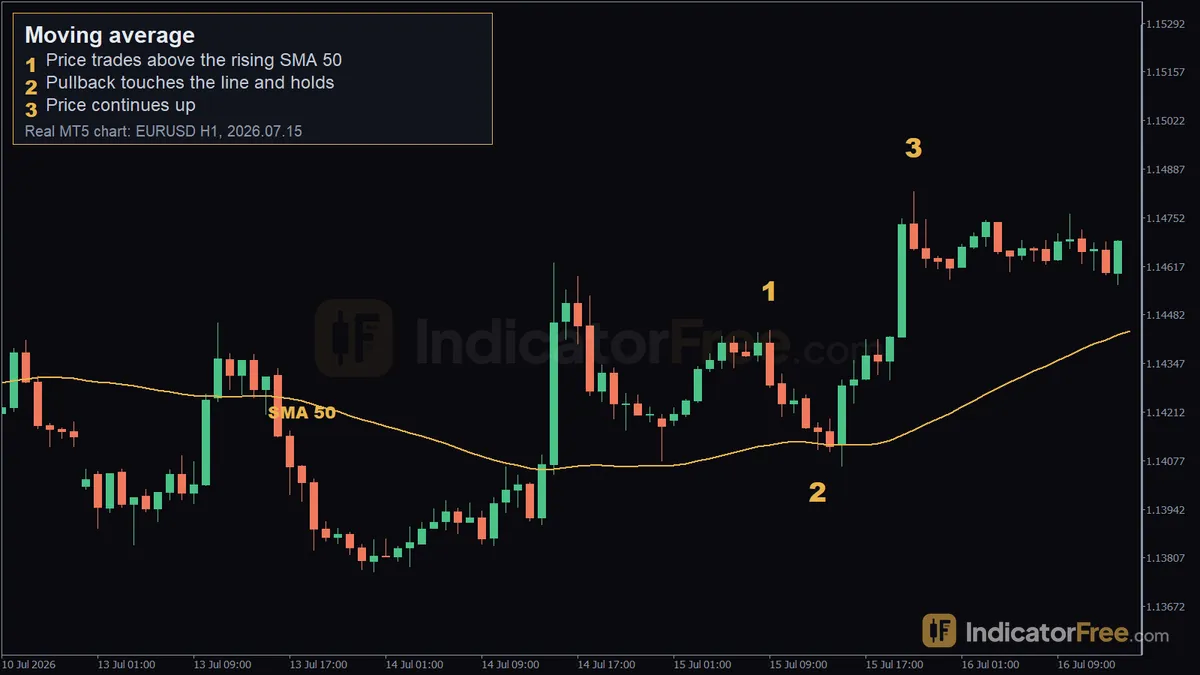
On a EURUSD H1 chart, price closed above a rising SMA 50 for 15 straight candles — over that stretch price moved roughly 67 pips. Within that run, at 2026.07.15 09:00 price was trading at 1.14438, above the rising line. At 13:00 the candle's low (1.14107) dipped into the SMA 50 (1.14125) and still closed back above it — a pullback that held rather than broke the average. Price then continued higher, reaching 1.14824 by 21:00. This is a single past example from one chart, not a signal to expect the same move again.
When a moving average works well, and when to avoid it
Market conditions and timeframe:
- Works best when price is trending — the line stays on one side of price and pullbacks to it tend to hold.
- Struggles in a sideways market — price chops back and forth across the line with no clear edge.
- Higher timeframes (H4, D1) give fewer but more reliable touches and crosses; lower timeframes (M5, M15) give more signals but more false ones.
News and timing:
- Avoid trusting a pullback or cross right before a high-impact news release — a single headline can blow through the average in one candle regardless of the trend it was tracking.
- Treat the first few candles after major news with caution — the average is still catching up to a price that just gapped or spiked.
Moving average pros and cons
| Pros | Cons |
|---|---|
| Smooths price into one readable line | Lags — it only reflects closes that already happened |
| Works on any instrument and timeframe | Whipsaws in a sideways market |
| Easy to use as a trend filter or dynamic support/resistance | A single period is a compromise between speed and noise |
| Crossovers give a simple, objective signal | Crossover signals arrive after part of the move is already over |
Practical setups
//Pullback entry at a rising SMA 50 on EURUSD H1
- Entry trigger: Price had been trading above a rising SMA 50 for 15 candles (confirmed uptrend). At 13:00 the candle's low touched the SMA 50 (1.14107 vs the line at 1.14125) and closed back above it, so an entry on that close, near 1.14125, would have caught the next leg up.
- Stop loss: Hypothetically, below the pullback low — under 1.14107 — so a close back under the SMA 50 invalidates the pullback.
- Exit: In this example price continued up to 1.14824 by 21:00. A trader could take profit there, trail the stop under the SMA 50, or scale out — this is one past outcome, not a target to expect on the next setup.
Choosing the period for your trading style
| Style | Timeframe | Typical period(s) |
|---|---|---|
| Scalping | M5 / M15 | Short, fast-reacting periods (e.g. 9–21) to catch quick swings |
| Day trading | H1 | Medium periods (e.g. 20–50) to filter noise while staying responsive |
| Swing trading | H4 / D1 | Longer periods (e.g. 50–200) to track the broader trend |
On gold (XAUUSD), the Lab's H1 data shows price crosses its own SMA 20 and SMA 50 about as often as on EURUSD H1, and slightly more often at the 50-period setting — so a gold chart at the same settings will not necessarily feel calmer than a major FX pair.
What the Lab measured
The IndicatorFree Lab counted crosses and price-crossing-the-line events over 12 months of broker demo data (2025-10-02 to 2026-10-02). This is past data, not a forecast:
- EURUSD H1 (6,222 candles): SMA 20/50 crossed 10.8 times/month (130 crosses, 4% reversed within 5 candles); SMA 50/200 crossed 3.5 times/month (42 crosses, 0% reversed); EMA 9/21 crossed 22.6 times/month (271 crosses, 21% reversed); EMA 20/50 crossed 8.9 times/month (107 crosses, 16% reversed).
- EURUSD H1: price closed across its SMA 20 13.6 times/week, across SMA 50 7.7 times/week, across SMA 200 4 times/week.
- EURUSD H4 (1,556 candles): SMA 20/50 crossed 3.3 times/month (8% reversed); SMA 50/200 crossed 0.8 times/month (0% reversed); EMA 9/21 crossed 5.6 times/month (19% reversed); EMA 20/50 crossed 3.3 times/month (12% reversed).
- XAUUSD H1 (5,917 candles): SMA 20/50 crossed 11.2 times/month (7% reversed); SMA 50/200 crossed 3.3 times/month (10% reversed); EMA 9/21 crossed 21.9 times/month (24% reversed); EMA 20/50 crossed 10.4 times/month (14% reversed). Price crossed its SMA 20 13 times/week, SMA 50 8.7 times/week, SMA 200 3 times/week.
- XAUUSD H4 (1,548 candles): SMA 20/50 crossed 2.6 times/month (3% reversed); SMA 50/200 crossed 0.8 times/month (0% reversed); EMA 9/21 crossed 5.1 times/month (28% reversed); EMA 20/50 crossed 2.8 times/month (18% reversed).
Across both symbols, the longer the period and the higher the timeframe, the fewer crosses happen and the fewer of them get reversed within 5 candles. Fast EMA pairs (9/21) cross far more often and get reversed far more often than slow SMA pairs (50/200).
Practical tips
- Match the period to how long you plan to hold a trade — a scalp needs a faster line than a swing position.
- Use the slope, not just price's position relative to the line, to judge whether the trend is still active.
- A moving average works as a trend filter even when you're not trading it directly — only take other signals in the direction the line is pointing.
- Give a pullback a full candle close to confirm it held, rather than reacting to a wick that only touches the line.
- On choppy, sideways charts, expect more crosses and more of them to fail — this is normal, not a broken setting.
- Combine a fast and a slow moving average rather than relying on one line alone, so a cross has to agree with the broader direction.
Quick checklist
- Is the line's slope clearly up or down, not flat?
- Did the pullback candle close back on the trend side of the line, not just wick into it?
- Is the period matched to your holding time (fast for scalping, slow for swing)?
- Is there major news due before you'd need the trade to play out?