Simple moving average
Also called SMA
A simple moving average (SMA) is the average closing price of the last N candles on an MT5 chart, plotted as one line to show trend direction and pullback levels.
A simple moving average (SMA) is the average closing price of the last N candles on your MT5 chart, recalculated every time a new candle closes and plotted as one line. Traders use it to read the current trend direction, watch for pullback entries, and build crossover signals between a fast and a slow SMA.
The SMA formula and what the line shows
An SMA adds up the closing price of the last n candles and divides by n:
SMA(n) = (Close1 + Close2 + ... + Closen) / n
Each time a new candle closes, the oldest close drops out of the window and the newest one is added, so the line is recalculated bar by bar. Every candle in the window counts equally — a close from 19 bars ago moves the average by exactly as much as the candle that just closed. That equal weighting is the main difference from an exponential moving average, which leans on recent closes more heavily.
Reading the SMA 20 on an EURUSD chart
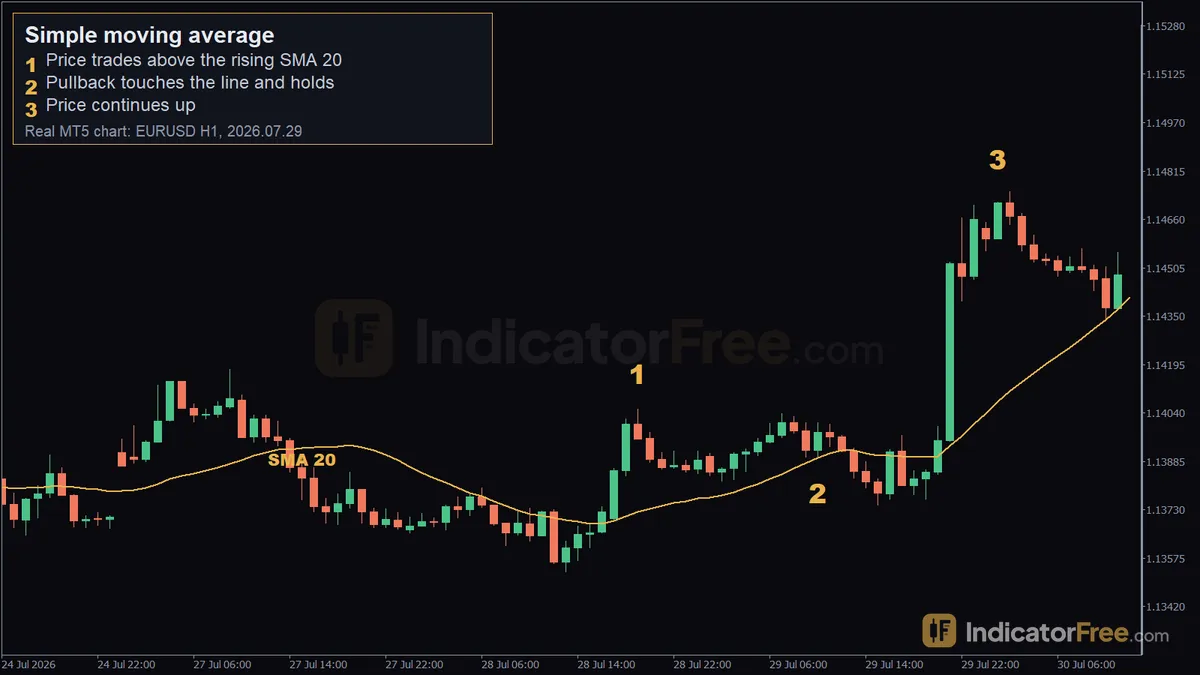
On the EURUSD H1 chart above, price closed above a rising SMA 20 for 15 straight candles. Price was trading above the line at 2026.07.28 19:00 (1.14052), then pulled back to 1.13902 on 2026.07.29 10:00 — right at the SMA 20 value of 1.13896 — and the candle still closed above it. Price then continued to 1.14716 by 2026.07.30 01:00, a 74-pip move from the pullback low over those 15 candles. That is a past example, not a forecast: the same pullback can just as easily fail and close below the line.
When the SMA works well, and when to avoid it
Conditions that favor it:
- A trending market, with the SMA sloping steadily in one direction
- Price repeatedly touching the line on pullbacks and closing back on the trend side
- H1 and higher timeframes, where the line is smoother and less affected by single-candle noise
Conditions to avoid:
- A range-bound market, where price crosses the SMA back and forth with no follow-through
- The minutes around high-impact news releases, when a spike can punch through the line before it reacts
- Very low timeframes or very short periods, where the line reacts to noise almost as fast as price itself
Simple moving average: pros and cons
| Pros | Cons |
|---|---|
| Smooths candle noise so trend direction is easier to read | Lags price — it only turns after enough new candles have closed |
| Round periods like 50 and 200 are widely watched, so they often act as real support/resistance | Equal weighting of old and new candles makes it slower to turn than an EMA |
| Simple to calculate and plot on any timeframe or symbol | Whipsaws in ranging markets, producing late or false pullback signals |
| Easy to pair with a second SMA for a crossover signal | A crossover can lag the actual turn by several candles, especially with longer periods |
Practical setups
//Buying the pullback to the SMA 20
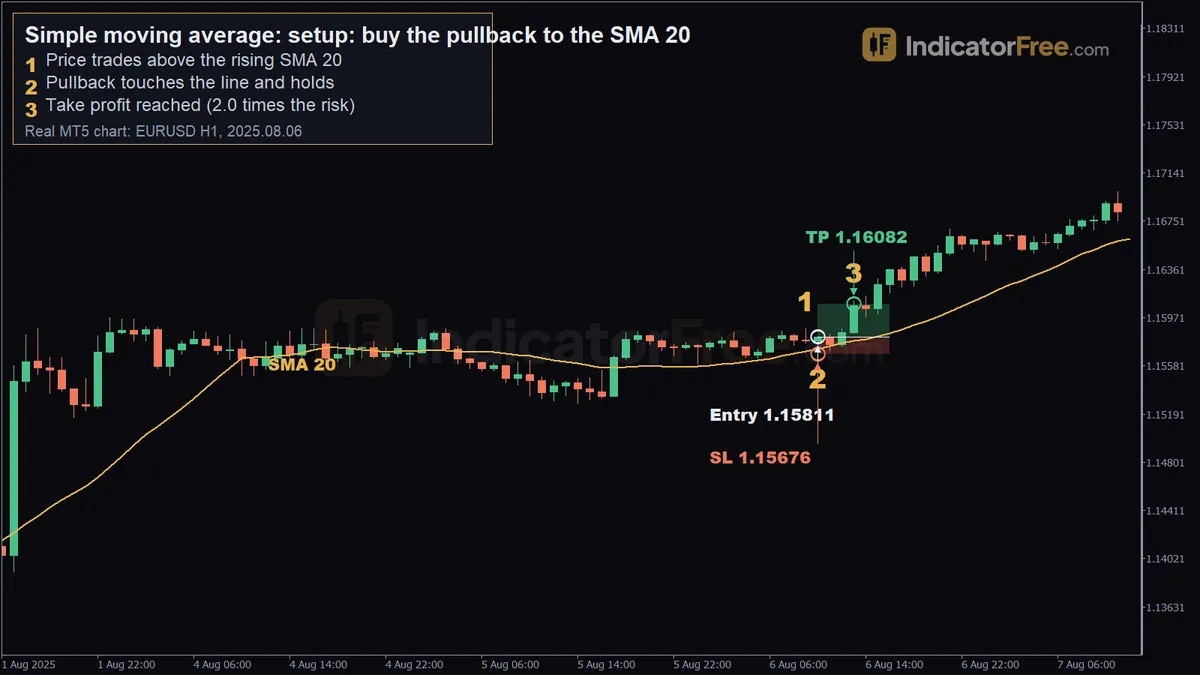
Simple moving average, setup: buy the pullback to the SMA 20: real EURUSD H1 MT5 chart (2025-08-06).
On EURUSD H1, price had closed above a rising SMA 20 for 15 candles, trading at 1.15881 on 2025.08.06 09:00. At 10:00 the low dropped to 1.15713, touching the SMA 20 (1.15719), and the candle still closed back above the line. Entry trigger: a candle closing back above the SMA 20 after the touch — a buy at 1.15811. Stop loss below the pullback low, at 1.15676 (14 pips risk). Exit: a fixed 2.0R target at 1.16082, reached on 2025.08.06 13:00. This is one past example on one session, not a setup that repeats on demand.
//SMA 20/50 crossover
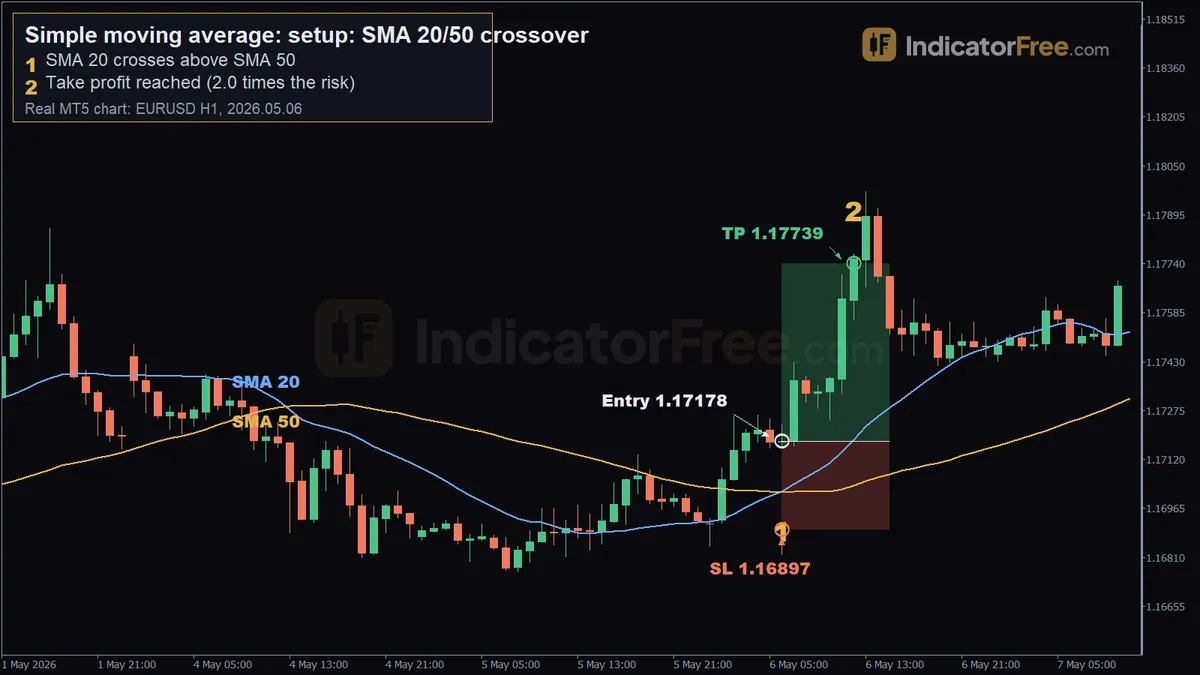
Simple moving average, setup: SMA 20/50 crossover: real EURUSD H1 MT5 chart (2026-05-06).
On the same pair, the SMA 20 (1.17017) crossed above the SMA 50 (1.17016) on 2026.05.06 at 06:00. Entry trigger: the fast SMA closing above the slow SMA — a buy at 1.17178. Stop loss at 1.16897 (28 pips risk). Exit: 2.0R at 1.17739, reached at 12:00, after price moved 79 pips over the following 25 candles. A crossover confirms a trend change only after it has started; the Lab numbers below show how often this cross reverses quickly.
//Gold (XAUUSD): pullback to the SMA 50
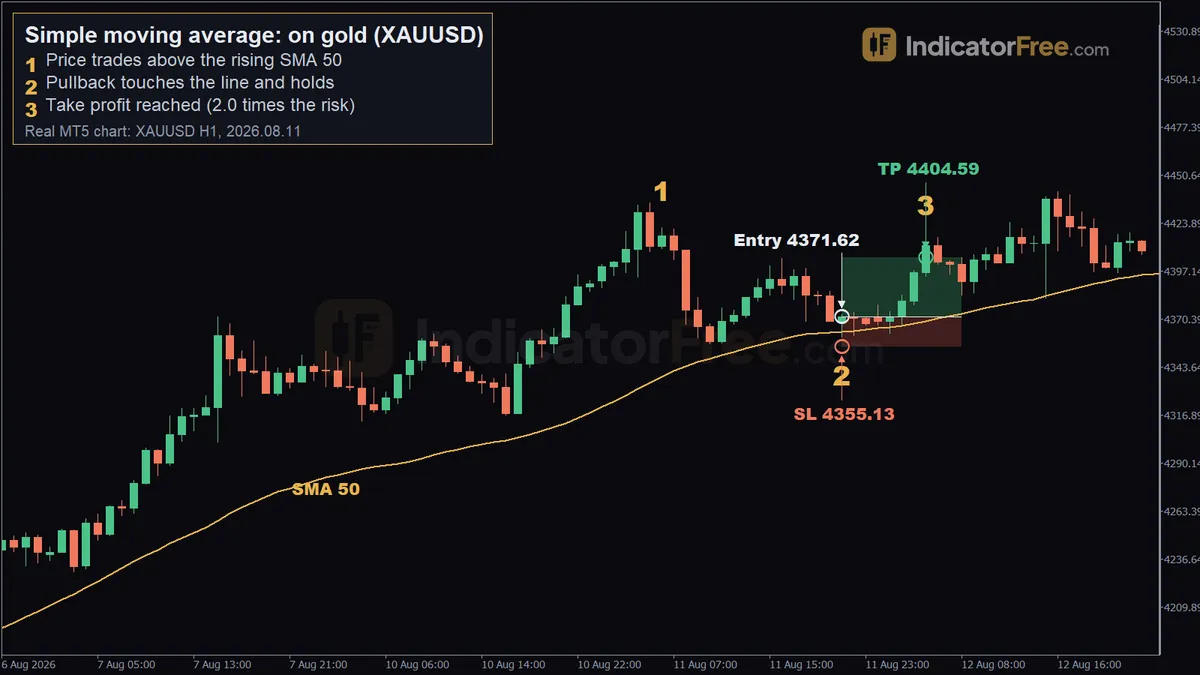
Simple moving average, on gold (XAUUSD): real XAUUSD H1 MT5 chart (2026-08-11).
The same pullback idea on gold, using the SMA 50: price traded above a rising SMA 50 at 4421.60 on 2026.08.11 06:00, then pulled back to a low of 4360.32 at 21:00 — against an SMA 50 of 4363.36 — and closed back above it. Entry at 4371.62, stop loss at 4355.13 (16.49 in price risk), and a 2.0R exit at 4404.59, reached on 2026.08.12 05:00. The risk here is quoted in price, not pips, since gold is priced differently from FX pairs.
Choosing the SMA period for your trading style
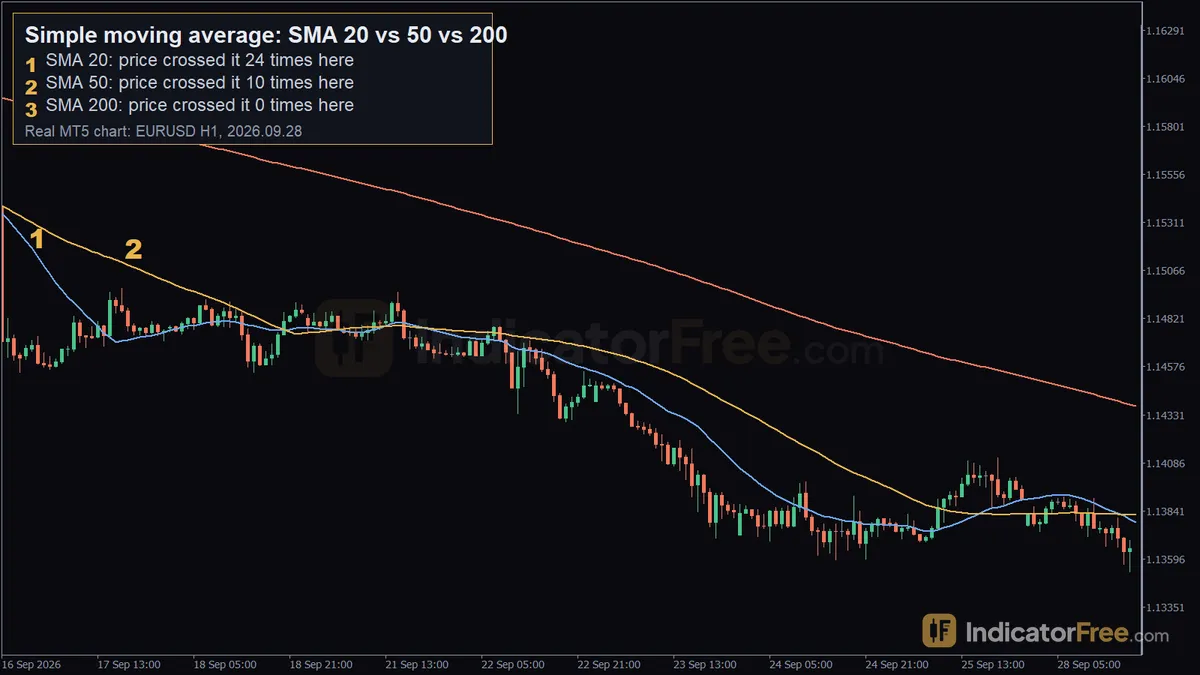
Simple moving average, SMA 20 vs 50 vs 200: real EURUSD H1 MT5 chart (2026-09-28).
The comparison chart above shows how differently each period behaves on the same EURUSD H1 chart over 190 candles (2026.09.16 19:00 to 2026.09.28 17:00): the SMA 20 was crossed 24 times, the SMA 50 ten times, and the SMA 200 was never crossed. The shorter the period, the more often price crosses it and the more signals — and false signals — it produces.
| Trading style | Typical timeframe | Period commonly used | Why |
|---|---|---|---|
| Day trading | H1 | 20 and 50 | Matches the pullback and crossover setups above, both built on H1 closes |
| Swing | H4 / D1 | 50 and 200 | On EURUSD H4 the SMA 50/200 crossed only 0.8 times a month in the Lab data below, and on the H1 comparison chart above the SMA 200 was never crossed in 190 candles — both point to fewer, longer-lasting signals |
On gold the same periods are used, but moves are measured in dollars rather than pips — the SMA 50 pullback above risked 16.49 in price. Major FX pairs keep risk in pips, which is usually easier to size consistently trade to trade.
What the Lab measured
Over 12 months of broker demo data in MT5 (2025-10-02 to 2026-10-02), past data, not a forecast:
| Symbol / timeframe | Candles | SMA 20/50 crosses per month | Reversed within 5 candles | SMA 20 closes crossed per week |
|---|---|---|---|---|
| EURUSD H1 | 6,222 | 10.8 (130 crosses) | 4% | 13.6 |
| EURUSD H4 | 1,556 | 3.3 (40 crosses) | 8% | 3.5 |
| XAUUSD H1 | 5,917 | 11.2 (134 crosses) | 7% | 13 |
| XAUUSD H4 | 1,548 | 2.6 (31 crosses) | 3% | 3.9 |
The slower SMA 50/200 cross was rarer and reversed less: on EURUSD H1 it crossed 3.5 times a month (42 crosses) with 0% reversed within 5 candles; on XAUUSD H1 it crossed 3.3 times a month (39 crosses) with 10% reversed.
Practical tips
- Wait for the candle to close back on the trend side of the SMA before acting on a pullback — a wick touch alone is not the setup shown above.
- A rising SMA with price above it describes an uptrend; a falling SMA with price below it describes a downtrend. A flat SMA with price crossing it back and forth usually means there is no trend to trade.
- Longer periods (50, 200) cross less often and reverse less often, per the Lab numbers above; shorter periods (20) give more signals but more of them reverse quickly.
- On gold, size stops in price, not pips, and expect larger absolute moves than on EURUSD for the same period.
- A two-SMA crossover adds confirmation but adds lag — the cross example above only triggered after price had already moved from 1.17017 to 1.17178.
- Avoid acting on a touch of the SMA during a scheduled high-impact news release; a spike can cross the line and reverse within the same candle.
Quick checklist
- Is the SMA sloping in one clear direction, not flat?
- Did the candle close back on the trend side of the line, not just wick it?
- Is the stop placed beyond the pullback low/high, not a fixed pip count?
- Are you outside a high-impact news window?
- If using a crossover, has price already moved far enough that the stop still makes sense?
FAQ
Is a simple moving average used for forecasting? No. The SMA only averages past closes — it describes where price has been, not where it will go. Any forward read, like the pullback examples above, is a past example, not a prediction for the next trade.
Simple moving average vs exponential moving average — what changes on the chart? Both plot one smoothed line, but the SMA weights every candle in the window equally, while the exponential moving average weights recent candles more. On the same chart, the EMA usually turns sooner after a change in direction; the SMA turns later but reacts less to a single noisy candle.