Weighted moving average
Also called WMA, LWMA
A weighted moving average (WMA) is a moving average that multiplies recent closes by a higher weight than older ones, so it turns faster than a simple moving average.
A weighted moving average (WMA) multiplies each price in its lookback period by a weight based on how recent it is, so the newest close counts the most and the oldest counts the least. Traders use it as a faster-reacting trend line than a simple moving average, plotted directly on the price chart.
How the WMA formula weights each candle
The standard (linear) WMA gives weight 1 to the oldest close in the period and weight n to the newest one, then divides by the sum of the weights:
WMA = (P1 x n + P2 x (n-1) + ... + Pn x 1) / (n + (n-1) + ... + 1)
P1 is the most recent close, Pn is the oldest close in the period. Because recent prices carry more weight, the line turns sooner after a price swing than a simple moving average of the same length, but it is still smoother than price itself. This calculation is commonly called a weighted moving average or a linear weighted moving average (LWMA) — the two names describe the same formula. On MT5, it is available as the "Linear Weighted" method inside the standard Moving Average indicator, rather than as its own separate entry in the indicator list.
Reading a WMA crossover on the chart
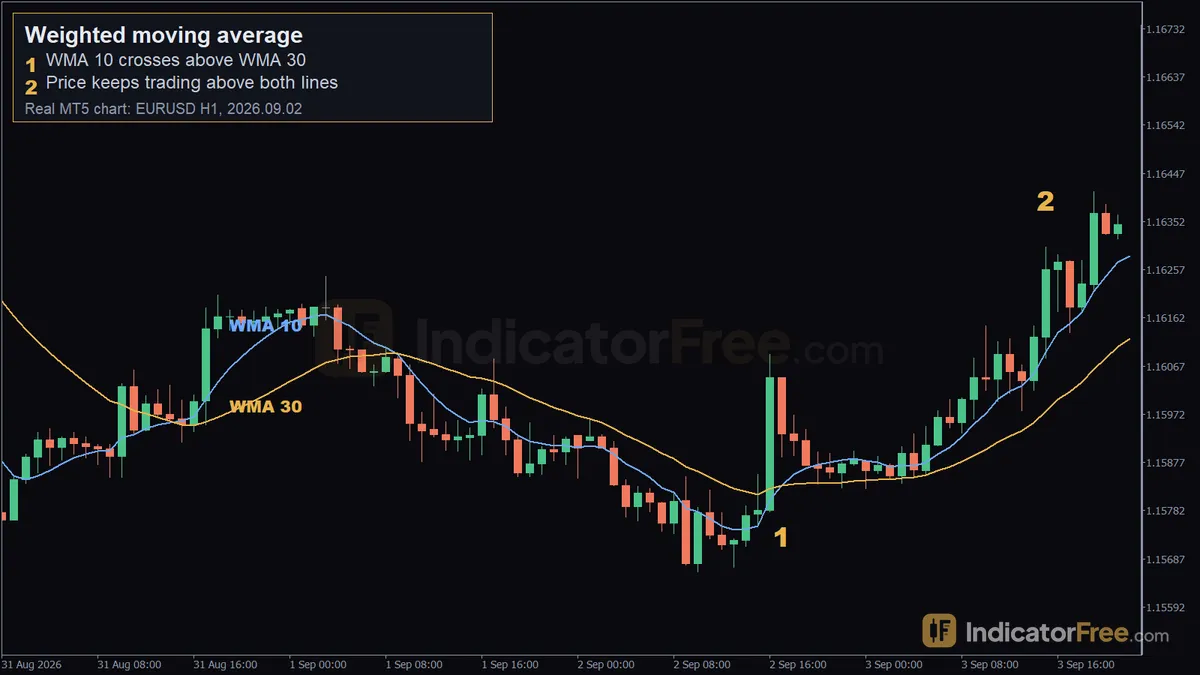
The example below is a past case on EURUSD H1, not a forecast of future WMA behaviour. A 10-period WMA crossed above a 30-period WMA on 2026.09.02 at 17:00, with the fast line at 1.15832 against the slow line at 1.15831. Marker 1 shows price itself trading above both lines at that same moment, at 1.15887. Marker 2 shows price still above both WMAs the next day, on 2026.09.03 at 15:00, at 1.16302 — about 22 hours after the cross. Over the 25 candles following the cross, price moved 37 pips higher. On the chart, the useful read is simple: when the fast WMA sits above the slow WMA and price holds above both, the short-term trend is up; when candles start closing back through the fast line, that read is weakening.
When a WMA cross holds up, and when to skip it
Conditions where a WMA cross is more useful:
- The market is trending in one direction over several hours or days, not chopping sideways
- Higher timeframes such as H4 or D1, where price swings are bigger relative to noise
- Calm sessions without a major scheduled release due in the next few hours
Conditions where it is better to skip or wait:
- A ranging or sideways market, where the fast and slow WMA cross back and forth repeatedly
- Very low timeframes such as M1 or M5, where small wicks flip the lines without any real trend behind them
- Around high-impact news (rate decisions, NFP, CPI) where price can gap or spike faster than any moving average can track
WMA pros and cons
| Pros | Cons |
|---|---|
| Reacts faster to new price moves than an SMA of the same length | Still lags price, because it is built from past closes |
| Puts the most weight on the candle a trader actually cares about: the latest one | Can whipsaw in a ranging market, same as other moving averages |
| Simple to read as a single trend line, or as a fast/slow pair for crossovers | Gives no information about volume or momentum on its own |
| Available as a method option on standard moving average indicators | Choosing the period is a judgment call, not a fixed rule |
Practical setups
//WMA 10/30 crossover continuation (EURUSD H1 example)
[main example | EURUSD H1]
Using the chart above as a worked example: the entry trigger is a candle close above both WMAs after the fast line crosses above the slow line, around the 1.15887 level marked on the chart. A hypothetical stop loss would sit a few pips below the slow WMA's value at the time of the cross, near 1.15831, or below the most recent swing low if that sits further away. A hypothetical exit is either a fixed target once price has moved a set number of pips, or a trail that closes the trade once a candle closes back below the fast WMA — in this past example, price was still trading above both lines the next day near 1.16302, so a trend-following exit would still have been open at that point.
Choosing the WMA period
| Trading style | Timeframe | Typical WMA pairing (example) |
|---|---|---|
| Scalping | M5 / M15 | 5-10 fast, 20 slow |
| Day trading | H1 | 10-20 fast, 30-50 slow |
| Swing trading | H4 / D1 | 50 fast, 100-200 slow |
These are starting points to test, not fixed settings. On gold (XAUUSD), price typically swings by more points per candle than on major FX pairs like EURUSD, so a WMA pair tuned for EURUSD will tend to cross more often on gold at the same periods — many traders either lengthen the periods on gold or accept more frequent crosses.
Practical tips
- Plot a fast and a slow WMA together if you want crossover signals; a single WMA only gives a trend bias, not an entry point
- Wait for a candle close beyond the WMA line rather than reacting to a wick touching it intrabar
- Check the trend on a higher timeframe before acting on a WMA cross on a lower one
- Expect more crosses on gold than on calmer FX pairs at the same settings, simply because gold moves further per candle
- Use the WMA as a trailing reference in a running trend, not only as a one-off entry signal
- In a tight range, filter out crosses where the two lines are barely separated — those tend to flip back quickly
Quick checklist
- Trend direction on your timeframe agrees with the WMA cross
- Candle closed beyond the line, not just a wick
- No major news event due before your planned exit
- Stop loss placed beyond the slow WMA or the nearest swing point
- Period choice matches your trading style and the instrument's typical range