Trend line
Also called Trendline, TL
A trend line is a straight line drawn across two or more swing highs or swing lows to show the general direction of price and mark areas where price has reacted before.
How it works
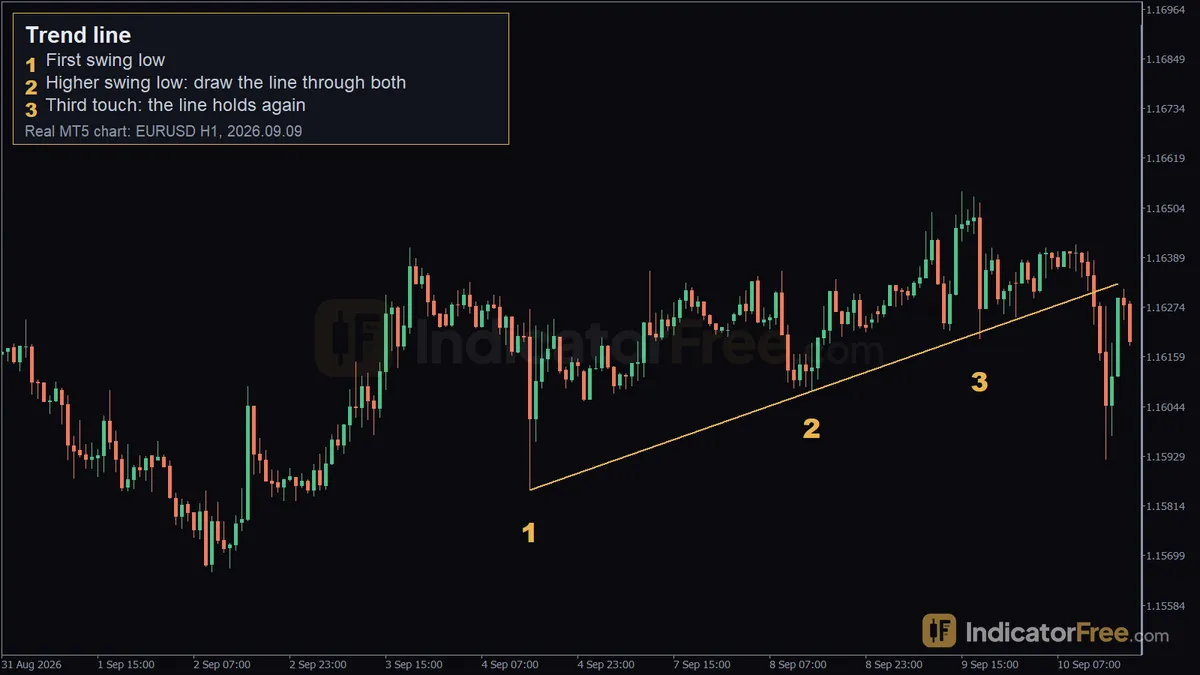
A trend line connects at least two points on a chart. In an uptrend you draw it under the swing lows; in a downtrend you draw it over the swing highs. The line's slope is just the price change divided by the time between the two points: slope = (price2 − price1) / (time2 − time1). Once two points are joined, the line is extended forward. A third touch, where price comes back to the line and reacts again, is normally taken as the first sign that the line is being respected rather than random.
There's no fixed formula for where a valid trend line "must" sit — it depends on which swing points a trader chooses to connect. That's also the main weakness: two traders can draw two different lines on the same chart and both can defend their choice.
Example
This is a past example on EURUSD H1, not a forecast. On 2026.09.04 at 15:00, EURUSD printed a swing low at 1.15851 (marker 1). On 2026.09.08 at 14:00, it printed a higher swing low at 1.16080 (marker 2). Drawing a straight line through those two lows gives a rising trend line. On 2026.09.09 at 18:00, price pulled back down to 1.16201 and touched that same line again (marker 3) before turning back up. In this instance, price rose 21 pips over the next 15 candles after the third touch. A single bounce like this doesn't prove the line will hold next time — it only shows how the line was being used on that chart at that moment.
How to use it on MT5
- Open the chart and select the Trendline tool from the toolbar (or Insert → Line Studies → Trendline).
- Click on the first swing low (or high) and drag to the second swing point, then release to draw the line.
- Double-click the line to select it, then drag either end to fine-tune where it touches the candles.
- Right-click the line → Line Properties to extend it to the right so you can see where it projects into future candles.
- Watch how price behaves the next time it reaches the line — a clean bounce, a close through it, or a wick through it all mean different things, so read the reaction rather than the line alone.
- Save the chart template if you want the same line style on other symbols or timeframes.
Common mistakes
- Forcing a line through only two points without waiting for a third touch to check it means anything.
- Redrawing the line every time price breaks it, which hides the fact that the original line failed.
- Drawing trend lines on a timeframe that doesn't match the trade's holding period, e.g. using an M1 line for a swing trade.
- Treating a trend line break as an automatic signal without checking candle closes, volume, or other confirmation.
- Ignoring that a steep trend line is mathematically unsustainable over a long period, since price would need to keep accelerating at the same rate.
FAQ
Does a trend line predict where price will go next? No. It describes the slope between past swing points; price can respect it, break it, or ignore it at any time.
How many touches make a trend line valid? There's no fixed rule, but most traders want at least a third touch before treating the line as meaningful rather than a line drawn through two random points.