Death cross
Also called DC
A death cross is when a shorter moving average crosses below a longer one, most often the 50 below the 200, flagging that momentum has turned down.
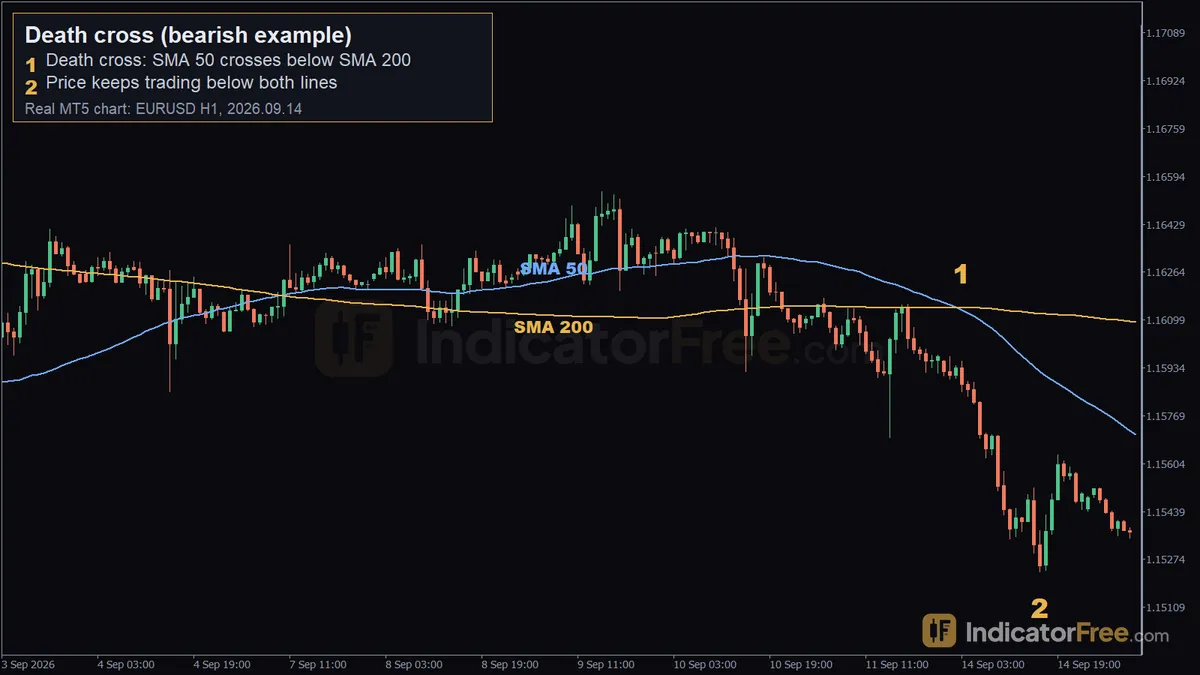
A death cross is a moving-average crossover: a shorter-period average crosses from above to below a longer-period average on the price chart, most commonly the 50-period crossing below the 200-period. Traders watch for it as a lagging signal that momentum has turned down, often using it to avoid buying into a weakening market or to screen for short setups.
Identification rules for a death cross
- Plot two moving averages on the same chart: a short period and a long period (the 50 and 200 are the most common pairing).
- Wait for the short average to cross from above to below the long average.
- Confirm the cross on a closed candle - the lines can still shift while the current candle is forming.
- Check that price itself is trading at or below both averages around the time of the cross, not just the averages crossing in isolation.
- Record the date, time and price of the candle where the cross happens - this becomes your reference point for everything that follows.
- Watch the next several candles. In a clean death cross, price stays under both averages instead of snapping straight back above them.
Valid death cross vs a weak or broken one
A death cross reads as valid when the long average is itself flattening or turning down, when price closes below both lines rather than just poking under them, and when the move continues for more than a candle or two afterward. The two averages should be visibly separating, not sitting on top of each other.
It reads as weak or broken when the market is ranging and both averages are flat and tangled together - the short average can cross back and forth over the long one several times with no real move in between. It also tends to be weak when the cross happens right into a strong support zone, or when the candle that produced the cross has a long wick back above the long average, hinting that sellers didn't fully commit.
The moving-average pair you choose changes how often this happens. On EURUSD H1 (2025-10-02 to 2026-10-02, 6222 candles, past data, not a forecast), the SMA 50/200 pair crossed 3.5 times per month (42 crosses) and 0% of those crosses were reversed by the next cross within 5 candles. Over the same period, the EMA 9/21 pair on the same chart crossed 22.6 times per month (271 crosses), with 21% reversed within 5 candles. Slower pairs cross rarely and don't flip back quickly in this data; faster pairs cross often and flip back more often.
A death cross on EURUSD H1 (the chart above)
The chart at the top of this page shows EURUSD on the H1 timeframe. On 2026.09.14 at 03:00, the 50-period SMA (1.16132) crossed below the 200-period SMA (1.16141). Marker 1 sits on that candle, where price was trading at 1.15957. Marker 2, at 16:00 the same day, shows price at 1.15232, still trading below both averages - roughly 72.5 pips below the cross price, about 13 hours later. Looking further out, over the full 25 candles that followed the cross, price moved 65 pips lower in total. This is one past example from the data above, not a prediction of how the next EURUSD cross will play out.
[IMAGE: main example | EURUSD H1]
//Trading the EURUSD H1 example from 2026.09.14
Taking that same chart as an illustration: the cross was confirmed with price at 1.15957 on the 03:00 candle. A hypothetical entry would be a sell on the open of the next candle, once that close below both averages was in place. A hypothetical stop loss would sit above a nearby swing high on the chart - the facts pack doesn't give an exact swing-high price here, so treat this as a structural stop placed above recent price structure, not a specific pip level. A hypothetical target could use the 65-pip move recorded over the 25 candles following the cross as a rough reference for how far this particular example ran, with the rest trailed behind price action. These entry, stop and target levels are hypothetical, built on top of a real past chart, not a signal to repeat on the next cross.
When a death cross works well, and when to leave it alone
It tends to read more clearly on higher timeframes and in markets that are already trending, where the long average is sloping in the same direction as the cross. It's also more useful as a filter alongside price structure - support, resistance, trend lines - than as a standalone entry trigger, since by definition it only confirms a move that has already started.
It's weaker in sideways markets, where flat averages produce crosses that don't lead anywhere, and with fast MA pairs, which cross often and reverse often. On XAUUSD H4 (2025-10-02 to 2026-10-02, 1548 candles, past data, not a forecast), the SMA 50/200 pair crossed 0.8 times per month (9 crosses) with 0% reversed within 5 candles, while the EMA 9/21 pair on the same chart crossed 5.1 times per month (61 crosses) with 28% reversed within 5 candles.
| Pros | Cons |
|---|---|
| Easy to spot on any chart without extra tools | Lagging by design - it confirms a move already under way |
| Slower pairs (like 50/200) cross rarely in the lab data above | Faster pairs (9/21, 20/50) cross often and reverse more often |
| Works as a trend filter alongside price structure | Carries no built-in stop loss or target |
| Applies the same way across forex, metals and indices | Loses meaning in flat, ranging conditions |
Bullish and bearish versions
The death cross is itself the bearish version of this moving-average crossover - the short average moving below the long one, pointing to downward momentum. Its bullish mirror is the golden cross, where the short average crosses back above the long average; that entry covers it on its own.
Practical tips for using a death cross on MT5
- Check which two periods are crossing before reacting - a 50/200 cross and a 9/21 cross on the same chart mean very different things.
- Wait for the candle to close before treating the cross as confirmed; the moving-average lines can still move while the current candle is forming.
- Look at the angle of both averages - a cross where the long average is already sloping down reads differently from one where it's still flat.
- Pair it with price structure such as swing highs, swing lows or a trend line rather than trading the cross alone.
- On MT5, plot both averages through Insert > Indicators > Trend > Moving Average and keep the shift at 0 so the lines track the current candle.
- Check the lab numbers for your symbol, timeframe and MA pair before trading it - a 50/200 pair behaves very differently from a 9/21 pair on the same chart.
Quick checklist
- Short average crosses below the long average on a closed candle.
- Price is trading below both averages after the cross, not snapping back above them.
- The long average is flattening or sloping down, not still rising.
- Slower MA pairs cross less often and reversed less often in the lab data above than fast pairs.
- Add your own stop and target from current chart structure - the cross itself doesn't set either.
FAQ
Does a death cross mean price will keep falling? No. It describes what two moving averages and price have already done, not what comes next. It's a lagging pattern, and the lab figures above are past counts over a fixed period, not a forecast for the next cross.
Does a death cross happen in stocks and gold, or only in forex? It's the same two-average crossover on any instrument's chart. The lab numbers above include both EURUSD and XAUUSD on H1 and H4, and the mechanics - short average crossing below long average - work the same way on stock indices.