Hull moving average
Also called HMA
The Hull moving average is a fast-turning moving average that layers weighted averages to cut lag, used on MT5 as a single trend line to read direction and trade pullbacks.
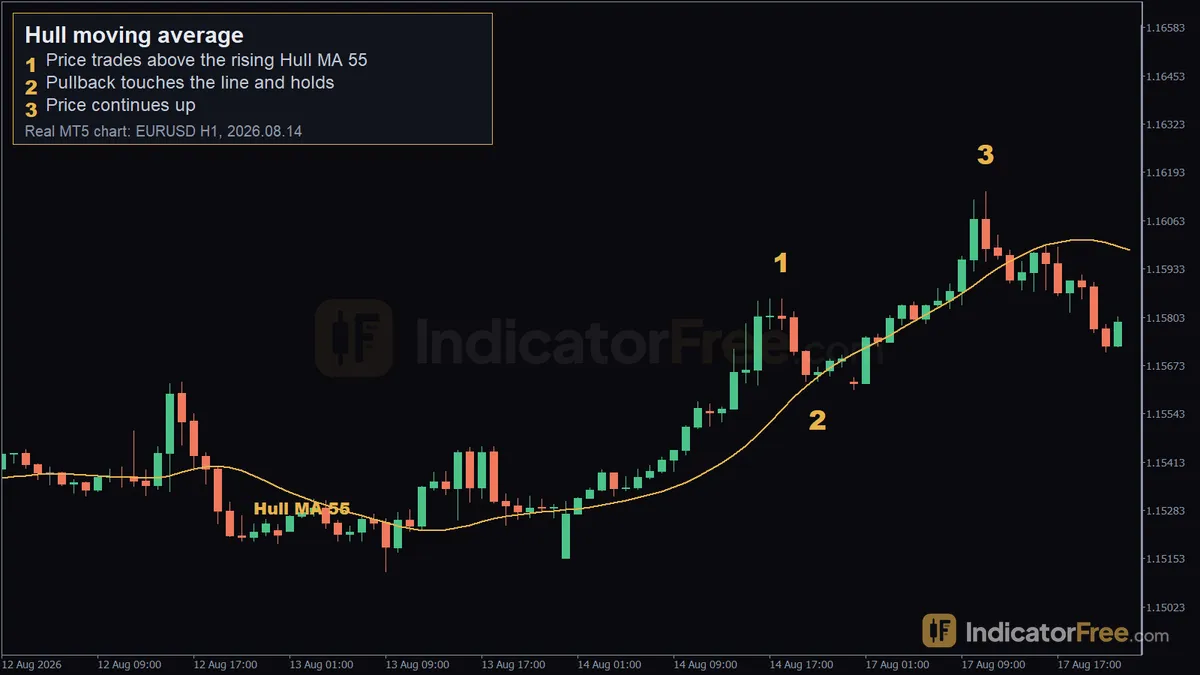
The Hull moving average (HMA) is a moving average built by Alan Hull from layered weighted averages, run through a square-root smoothing step that strips out most of the lag a normal moving average carries. Traders use it as a single trend line: price above a rising HMA signals an uptrend, and a pullback that holds on the line reads as a possible continuation entry.
The HMA formula and what the line shows
The Hull MA is a weighted moving average (WMA) of a weighted moving average:
HMA(n) = WMA( 2 × WMA(close, n/2) − WMA(close, n), round(√n) )
In words: take a WMA over half the period, double it, then subtract a WMA over the full period. That difference is smoothed again with a WMA using the square root of the period as its length. The double-and-subtract step removes most of the lag a plain WMA carries, so the final line sits closer to current price and changes slope sooner when momentum shifts. It still plots as one line on the price chart, same as an SMA or EMA — there's no separate panel or histogram.
Reading the Hull MA line on a chart
The line's slope is the trend read: rising means buyers are in control, falling means sellers are, and flattening means the move has stalled. Price's position relative to the line is the second read — staying on one side of it for many candles is a sign the trend leg hasn't ended yet.
On a EURUSD H1 chart, price traded above a rising Hull MA 55 for 15 straight candles. On 2026.08.14 at 18:00 the candle was trading at 1.15853, well above the rising line. By 2026.08.14 21:00 the candle's low (1.15631) touched the Hull MA 55 (1.15643) and the candle closed back above it — a pullback that held rather than broke the trend. Price then continued higher, reaching 1.16141 by 2026.08.17 11:00, a 49-pip move over those 15 candles.
[IMAGE: EURUSD H1 chart, Hull MA 55 rising, pullback to the line at 2026.08.14 21:00]
That is a single past example from historical data, not a forecast, but it shows the read: as long as candles keep closing above a rising HMA, a touch is treated as a pullback, not a reversal.
When the Hull MA works well, and when to avoid it
Works well:
- Markets that are trending, where price stays mostly on one side of the line for an extended run of candles
- H1 and higher timeframes, where a touch-and-hold pullback has enough room to play out before the next candle closes
- Calmer sessions, where the line's slope reflects the actual trend rather than a single outsized candle
Avoid or treat with caution:
- Sideways, range-bound markets, where price chops across the line repeatedly and every touch looks like a signal
- Very low timeframes (M1, M5), where normal noise is enough to flip the line's slope back and forth
- Around high-impact news releases, where a spike can tag the line and reverse within a candle or two before the HMA has time to adjust
Hull MA pros and cons
| Pros | Cons |
|---|---|
| Turns earlier than an SMA or EMA of the same length | Faster turning also means more sensitivity to a single sharp spike |
| Still plots as one simple line — easy to read on any chart | Not built into standard MT5; needs a custom indicator file |
| Works as a quick visual trend filter alongside other tools | No separate signal line, so crossovers need a second MA or price action to confirm |
| Smoother than raw price without feeling as sluggish as a long SMA | Can still whipsaw across price repeatedly in a flat market |
Practical Hull MA setups on MT5
//Pullback to a rising Hull MA 55 on EURUSD H1
Entry trigger: Wait for a trend where price is holding above a rising Hull MA 55, then wait for a pullback candle to touch the line and close back above it — as happened on 2026.08.14 21:00, when the low (1.15631) touched the HMA (1.15643) and the candle closed higher.
Stop loss: Hypothetically, a stop placed a small buffer below the touch candle's low (below 1.15631) would have sat outside the pullback, since a close back under that low would undo the signal.
Exit: Hypothetically, a trader holding from the close of the touch candle toward the next stall in the HMA's slope would have been in the move that reached 1.16141 by 2026.08.17 11:00 — a 49-pip run in this past example. This is one historical instance, not a rule for how every pullback resolves.
Choosing the Hull MA period for your trading style
| Trading style | Timeframe | Typical HMA period |
|---|---|---|
| Scalping | M5 / M15 | 9–21 |
| Day trading | H1 | 21–55 |
| Swing | H4 / D1 | 55–100 |
These are starting points to test, not fixed settings. The Lab's counts of plain moving-average crosses on EURUSD and XAUUSD (past data, not a forecast) land in a similar range on both H1 and H4 — for example EMA 9/21 crosses 22.6 times a month on EURUSD H1 versus 21.9 on XAUUSD H1, and SMA 20/50 crosses 3.3 times a month on EURUSD H4 versus 2.6 on XAUUSD H4. Gold does not cross noticeably more often than EURUSD in this data, so don't assume gold needs a longer Hull MA period purely because it's gold — test the period on each symbol separately.
Practical tips for using the Hull MA on MT5
- Standard MT5 does not ship with a Hull MA indicator built in — you need to add a custom indicator file to your MT5 Indicators folder before you can plot one.
- Treat a touch as a pullback only if the candle closes back on the trend side of the line; a close through the line the other way is a warning, not an entry.
- Check the HMA's slope on a higher timeframe before trading a pullback on a lower one, so the setup lines up with the bigger trend (see higher timeframe bias).
- Don't act on a touch in the middle of a scheduled news release; wait for the candle to close first.
- Pair the HMA's slope and touches with basic price structure (recent highs and lows) instead of trading the line on its own.
Quick checklist
- Line rising and price closing above it → trend intact
- Pullback touches the line and closes back on the trend side → possible continuation entry
- Line flattening or price chopping across it repeatedly → stand aside
- Stop placed beyond the touch candle's extreme, not just a few points from price
FAQ
Is the Hull moving average built into MT5? No. The standard MT5 terminal only includes Simple, Exponential, Smoothed and Linear Weighted moving averages. To plot a Hull MA you need to add a custom indicator file to MT5's Indicators folder.
Hull moving average vs EMA: what's the difference? Both weight recent price more heavily, but an EMA applies one smoothing factor across the whole series. The HMA combines two weighted averages of different lengths and runs the result through a further smoothing step, which lets it turn sooner at swing points than an EMA of the same length — at the cost of being more easily pulled around by a single sharp candle.