Sideways market
Also called ranging market, range-bound market, horizontal market, flat market, consolidation range
A sideways market is a price phase where price repeats between a fairly flat top and bottom instead of trending, so traders fade the edges or wait for a breakout.
A sideways market is a stretch of price action that moves between a fairly flat high and a fairly flat low instead of making new trend highs or new trend lows. Traders use it to avoid trend-following entries, to fade the edges of the range instead, and to wait for a clean break before treating the pair as trending again.
How to spot a sideways market
- Mark the most recent swing high and swing low that price has touched more than once.
- Check that price has turned back down from the upper level at least twice without closing far beyond it.
- Check that price has turned back up from the lower level at least twice without closing far beyond it.
- Measure the distance between the top and the bottom in pips or points, and judge whether that is narrow compared with how far the pair usually moves in a day.
- Confirm there is no steady run of higher highs and higher lows, or lower highs and lower lows, inside the band — that would be a trend, not a sideways market.
- Look at a moving average line (see moving average or exponential moving average): in a sideways market it stays close to flat and gets crossed by price repeatedly, instead of sloping and holding price on one side. Traders who want a single reading instead of drawing lines by hand often lean on trend-strength or volatility-squeeze indicators for the same check, though the steps above work without one.
What makes a range valid or not
A range reads as valid when both edges have been touched and respected at least twice, the turns happen close to the same price level each time, the range has held for more than a handful of bars, and candles inside it show no strong follow-through close beyond either edge.
A range reads as weak or broken when only one edge has a single touch so far, since one touch is not yet a confirmed level. It is also weak when the edges widen a little further every time price returns to them — that is usually a slow trend in disguise, not a flat range. And a range is broken, not sideways anymore, once a candle closes beyond an edge and price fails to snap back; at that point the pattern has turned into a breakout.
EURUSD H1 example: four turns inside one range
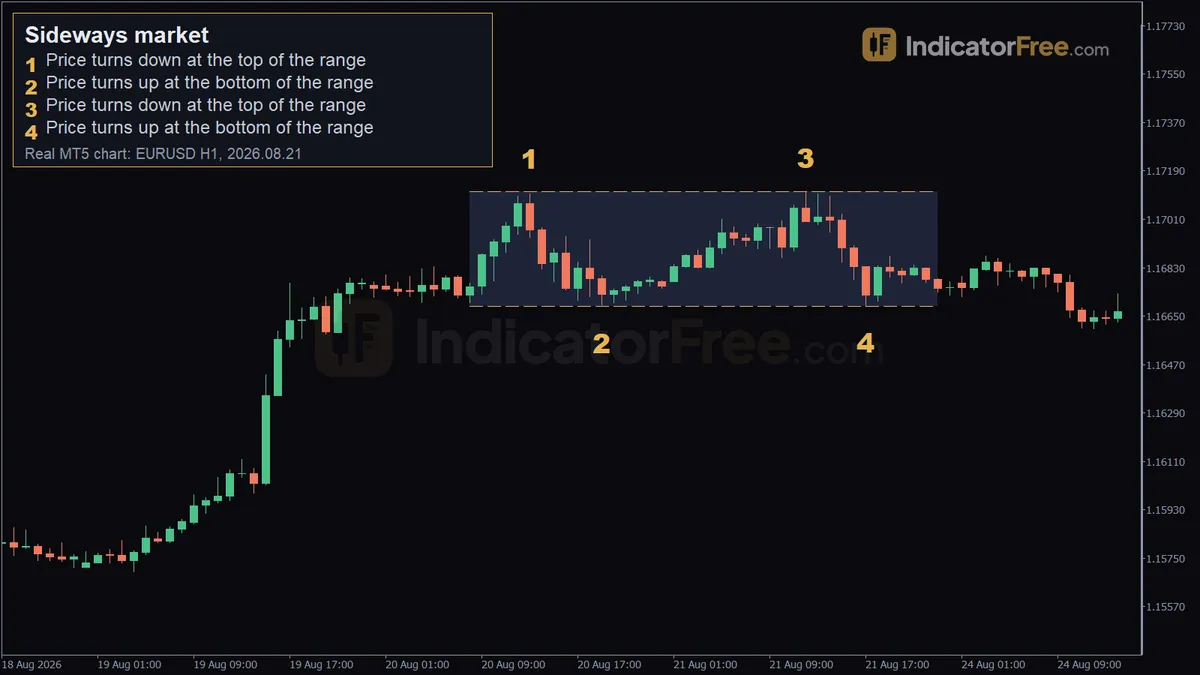
This is a past example, not a prediction. On EURUSD H1, from 2026.08.20 08:00 to 2026.08.21 23:00, price stayed between 1.16687 and 1.17113 — a band of 43 pips — and turned at the edges at least four times:
- At 2026.08.20 13:00, price turns down at the top of the range, at 1.17105.
- At 2026.08.20 19:00, price turns up at the bottom of the range, at 1.16692.
- At 2026.08.21 12:00, price turns down again at the top of the range, this time at 1.17113.
- At 2026.08.21 17:00, price turns up again at the bottom of the range, at 1.16687.
Across roughly a day and a half, price touched the top twice (1.17105 and 1.17113) and the bottom twice (1.16692 and 1.16687) without breaking out of the 43-pip band — the kind of repeated edge-respect that qualifies as a sideways market rather than a trend.
Trading the range: two practical setups
A sideways market strategy usually means trading the two edges of the range rather than following a trend. Both setups below use the same EURUSD H1 example above, told with its real prices; the stop and target distances are hypothetical, since the chart only shows where price actually turned, not where a stop or target should sit.
//Short at range resistance
Entry: a sell placed as price turns down near the top of the range — around 1.17105 (marker 1) or 1.17113 (marker 3) on this chart. Stop loss: hypothetically a few pips above the range high of 1.17113, since a close beyond that level would mean the range has broken. Target: hypothetically the opposite edge of the same range, near 1.16692 or 1.16687, where price turned up on this chart.
//Long at range support
Entry: a buy placed as price turns up near the bottom of the range — around 1.16692 (marker 2) or 1.16687 (marker 4) on this chart. Stop loss: hypothetically a few pips below the range low of 1.16687, since a close under that level would mean the range has broken. Target: hypothetically the opposite edge, near 1.17105 or 1.17113, where price turned down twice on this chart.
When this works and when to avoid it
Fading range edges tends to hold up when the range has already shown two or more touches per edge, when the range is wide enough to cover the spread and a reasonable stop, and when no major scheduled news is due before the trade would close. It tends to fail when the range is only a few hours old with one touch per side, when the edges are slowly drifting rather than staying flat, or right before high-impact news that can snap the range in one move.
| Pros | Cons |
|---|---|
| Clear, visible entry and exit levels at the edges | Range can break at any time without warning |
| Works without waiting for a trend to form | A narrow range leaves little room between entry and target |
| Easy to measure in pips before risking anything | Easy to mistake a slow trend for a flat range |
| Can be read from price alone, no indicator required | News releases can break the range suddenly |
Bullish and bearish breakouts from a range
When price finally closes above the top of a sideways range and holds there, the move often turns into a new uptrend; traders then track it with a rising trend line or a trend channel. A close below the bottom of the range that holds works the same way on the downside, usually followed by a falling trend line or trend channel. Both of those are covered in their own glossary entries and are not re-explained here.
Practical tips for trading a sideways market
- Measure the range in pips or points before entering, and check that a normal stop distance still leaves room for a target on the other side.
- Watch for the range narrowing further over time — a squeeze like this often comes before a breakout.
- Avoid holding a range trade through major scheduled news; a sideways market can break suddenly on a release.
- Use a flat moving average (see moving average, exponential moving average, or hull moving average) as a quick visual check that the pair is not trending.
- If a candle closes beyond an edge and price does not snap back, stop treating the setup as a range trade — a new trend may be starting.
- Use smaller position size inside a range than in a clear trend, since edges can be touched several times before any breakout actually holds.
Quick checklist
- Both edges touched and respected at least twice.
- Range wide enough for entry, stop and target to fit comfortably.
- No major news due before the trade is meant to close.
- Edge levels are flat, not slowly drifting wider.
- A close beyond either edge cancels the range idea.