Parabolic SAR
Also called SAR, PSAR, Stop and Reverse
Parabolic SAR is a trend-following indicator that plots dots above or below price; when the dots flip sides, it signals a possible change in trend direction.
Parabolic SAR (stop and reverse) is a trend-following indicator that plots one line of dots above or below price. When the dots flip sides, the indicator is signalling a possible change in trend direction. Traders use it to judge whether a trend is still running, and as a trailing stop level while a trade is open.
The SAR formula and what the dots show
Parabolic SAR calculates a new dot for every candle, based on the previous dot and an acceleration factor (AF) that grows while the trend keeps extending:
Rising trend: SAR(next) = SAR(current) + AF x (EP - SAR(current))
Falling trend: SAR(next) = SAR(current) - AF x (SAR(current) - EP)
EP is the extreme point: the highest high reached since the trend turned up, or the lowest low since it turned down. AF starts at the step value and adds one more step each time a new EP forms, up to the maximum. In MT5, the default Parabolic SAR settings are step 0.02 and maximum 0.2. There is only one plotted line - no separate signal line to cross against it.
Reading the Parabolic SAR dots on the chart
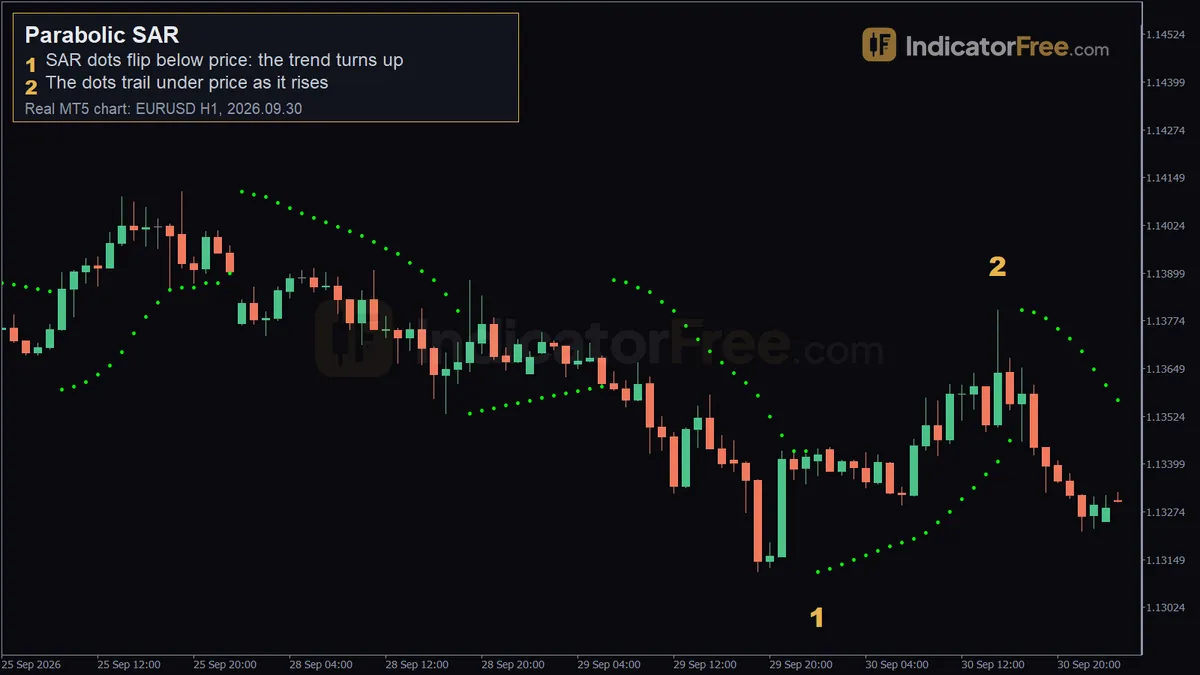
When the dots sit below the candles, SAR is reading the market as an uptrend, and the dots get pulled up as price rises, acting like a trailing stop. When price touches a dot, SAR flips to the other side of the candles - that flip is the indicator's main signal, and it is also what a parabolic SAR buy signal or sell signal looks like on the chart.
On EURUSD H1, past example, not a forecast: at 2026.09.30 00:00 the dots flipped from above to below price, printing near 1.13118 against that hour's close of 1.13424; the chart marks the flip point at 1.13368. By 2026.09.30 15:00 the trailing dot had moved up to 1.13803, still sitting under the rising candles. Over the 20 candles that followed the flip, price rose 38 pips.
When Parabolic SAR works well and when to avoid it
Market conditions and timeframes where it holds up:
- A market trending steadily in one direction, making a string of higher highs or lower lows.
- H1 and higher timeframes, where a single flip reflects a real shift rather than noise.
- Right after a clean breakout or a trend-channel continuation, used alongside a separate trend filter.
Situations to avoid:
- Sideways or ranging markets, where price chops across the dots and produces flip after flip.
- Very low timeframes (M1/M5) on volatile pairs, where spread and short-term noise trigger flips that don't last.
- Around scheduled high-impact news releases, when a single spike can flip SAR and then reverse straight back.
Parabolic SAR: pros and cons
| Pros | Cons |
|---|---|
| One line, easy to read at a glance | Flips often in ranging markets (whipsaws) |
| Doubles as a trailing stop level | Lags at the very start of a new trend |
| Plots on any symbol and timeframe in MT5 | Shows direction only, not trend strength |
| Easy to combine with a trend filter | Default step/maximum may be too fast for some pairs |
Practical setups
//Buying a SAR flip at the start of an uptrend (EURUSD H1, past example)
Entry trigger: the SAR dot flipped from above to below price at 2026.09.30 00:00, near 1.13118, with that candle closing at 1.13424 (the chart marks the flip at 1.13368). A trader using the flip as a trigger would buy on the close of the candle that confirms it, around 1.13424.
Stop loss: a stop placed just under the flip area, for example below 1.13118, matches the SAR logic - if price falls back through that level, the new uptrend reading is invalidated.
Exit: Parabolic SAR trails as a moving stop rather than a fixed target. By 2026.09.30 15:00 the dot had climbed to 1.13803, so a trader following the dots would have raised the stop to that level; price had risen 38 pips over the 20 candles since the flip, in this past example, not a forecast.
Choosing the SAR step and maximum by trading style
| Style | Timeframe | Typical approach |
|---|---|---|
| Scalping | M5 / M15 | MT5 default (step 0.02, maximum 0.2) reacts fast; expect more flips, so treat each one with caution |
| Day trading | H1 | MT5 default (step 0.02, maximum 0.2) is the standard starting point, as in the EURUSD example above |
| Swing trading | H4 / D1 | A smaller step (hypothetical, e.g. 0.01) slows the trail so dots flip less on small pullbacks - test before using |
Gold (XAUUSD) tends to move in larger point swings than major FX pairs, so the same step and maximum that suit EURUSD can flip too often on gold. Traders commonly lower the step for gold to slow the trail down; this is a hypothetical adjustment and should be tested on your own data before use.
Practical tips for using Parabolic SAR
- Pair SAR with a trend filter, such as a moving average, so you only act on flips that agree with the larger trend.
- Don't treat every flip as a trade signal in a ranging market - check the recent price structure first.
- Use the dots as a trailing stop reference even when you entered on a different signal.
- On news days, wait for the next candle or two rather than reacting to the first flip right after the release.
- Back-test the step and maximum on the specific symbol and timeframe before changing them from the MT5 default.
- Count how many flips happened in your test window; a high flip count usually means the market was ranging, not trending.
Quick checklist
- Dots below price = uptrend bias; dots above price = downtrend bias.
- A flip is a possible trend change, not an automatic trade.
- Use the dot level as a trailing stop reference.
- Be cautious of fresh flips right before or after major news.
- Confirm the flip with a separate trend filter before entering.
FAQ
Is Parabolic SAR a standalone trading strategy? It can generate buy and sell signals by itself, but in a choppy market it produces frequent opposing flips. Most traders pair it with a trend filter rather than trading the flips alone.
Does the SAR dot move after the candle closes? Once a dot is plotted for a candle that has closed, it stays where it was plotted. Only the dot for the current, still-forming candle can still change until that candle closes.