Order block
Also called OB
An order block is the last candle against the direction of a sharp price move, marking a zone traders watch for a later return and possible entry.
An order block is the last candle against the direction of a move before a sharp price swing - the last bearish candle before a rally, or the last bullish candle before a drop. Price action traders mark that candle's range as a zone where price may return before continuing, and use the zone to time entries, place stops, and set targets on an MT5 chart.
How to identify an order block
- Look for the last candle against the direction of a move - the last bearish candle before a rally, or the last bullish candle before a drop.
- Mark that candle's full range (high to low) as the zone, or just its body for a tighter zone - pick one method and stay consistent across a chart.
- Check what happened next: over the following few candles, price should move away fast and break a recent swing point, for example the high or low of the last 10 bars.
- Only treat the zone as live once that break has happened. A candle with no follow-through afterward is just a candle, not an order block.
- Wait for price to come back into the zone later. That return visit, not the original candle, is normally where a trade is considered.
- Watch how price reacts at the zone. A sharp move back in the direction of the original rally or drop is what traders look for; a slow grind through the zone is a warning sign.
Valid order block vs a weak or broken one
A zone reads as strong when the move away from it was fast, broke a clear swing high or low, and the zone has not been touched since it formed. The first return to a fresh zone usually gets more attention than the fifth.
A zone reads as weak when the move after the candle stalled, when price never broke the previous swing, or when the zone sits in the middle of a range with no clear structure around it. A zone is considered broken, or "mitigated", once price trades all the way through it and keeps going the other way - at that point it has done its job and traders stop using it as a source for new entries.
This is also where an order block differs from a fair value gap: an order block is the candle that started the move, while a fair value gap is the empty space left between candles during the move itself. The two often sit close together on a chart but mark two different things.
Real example: EURUSD rally from a bearish candle
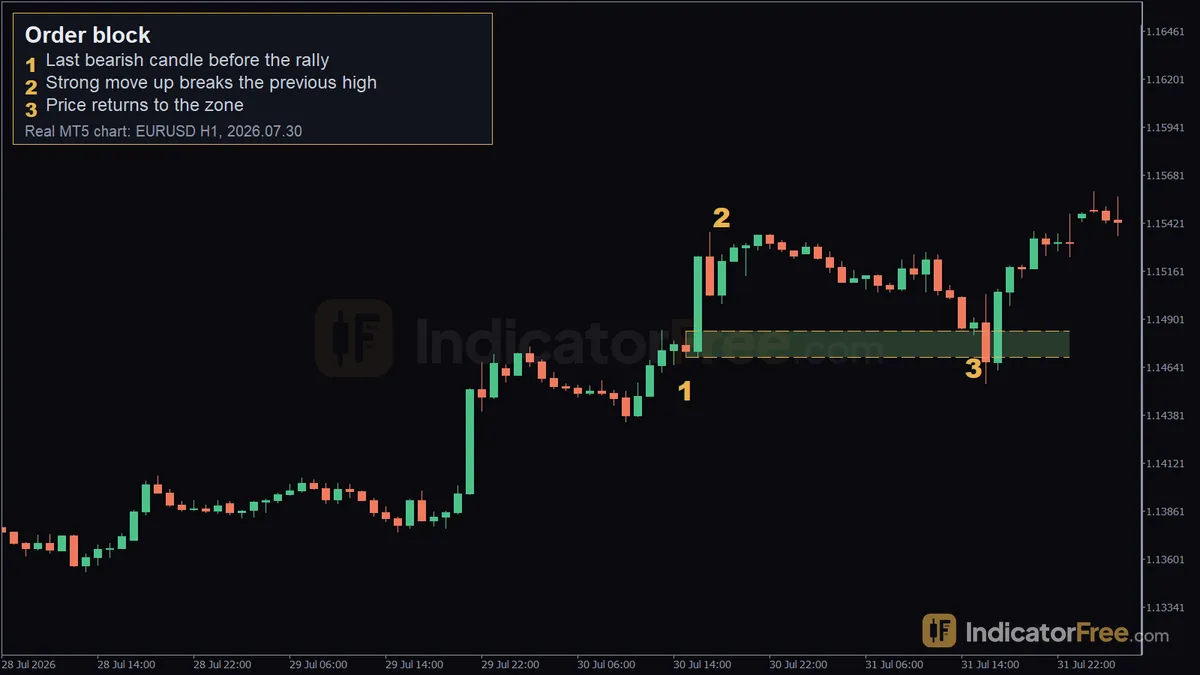
The chart at the top of this page shows a bullish order block on EURUSD H1, from 2026.07.30 to 2026.07.31. It is a past example, not a signal for future trades.
- Last bearish candle before the rally - this candle closed at 2026.07.30 15:00, with a zone from 1.14693 to 1.14834. That range became the order block zone.
- Strong move up breaks the previous high - over the next three candles price moved 52 pips, reaching 1.1525 by 2026.07.30 18:00 and breaking above the prior 10-bar high.
- Price returns to the zone - on 2026.07.31 15:00 price came back down to 1.14814, inside the zone, then moved 78 pips higher from there.
Bullish and bearish order blocks
A bullish order block is the last bearish candle before an upward move, as in the EURUSD example above - traders watch it as a possible point to buy. A bearish order block is the same idea in reverse: the last bullish candle before a drop, watched as a possible point to sell.
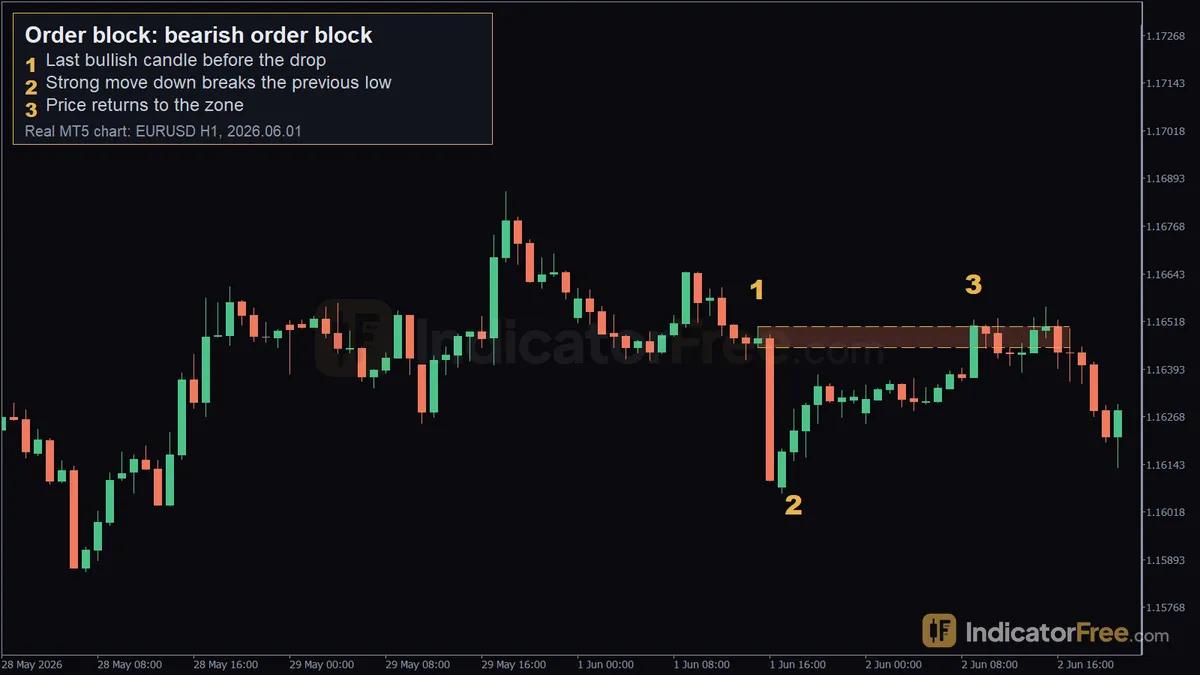
Order block, bearish order block: real EURUSD H1 MT5 chart (2026-06-01).
In this past EURUSD H1 example, the last bullish candle before a drop closed at 2026.06.01 15:00, with a zone from 1.16450 to 1.16505. Price then moved 27 pips over the next three candles and broke the prior 10-bar low, reaching 1.16152 by 2026.06.01 18:00. On 2026.06.02 09:00 price returned to 1.16522, inside the zone, then moved 25 pips lower.
Practical setups
//Buying the return to a bullish zone (GBPUSD)
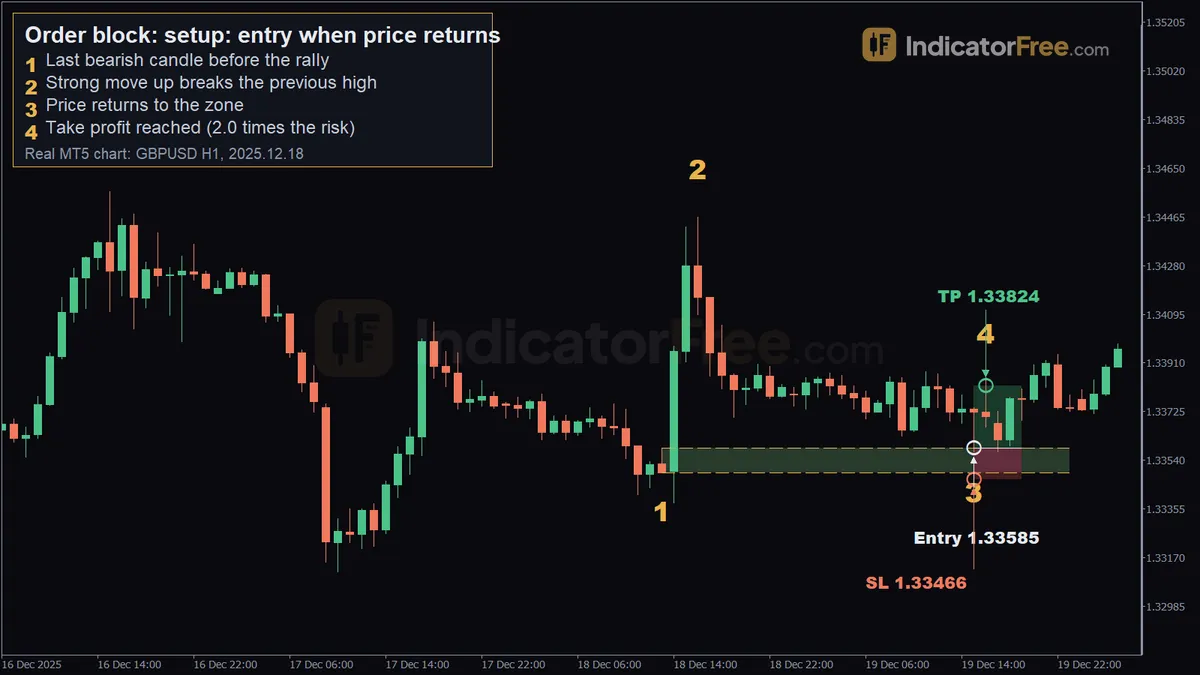
Order block, setup: entry when price returns: real GBPUSD H1 MT5 chart (2025-12-18).
On GBPUSD H1, the last bearish candle before a rally closed at 2025.12.18 13:00, with a zone from 1.33492 to 1.33585. Over the next three candles price moved 67 pips and broke the prior 10-bar high, reaching 1.34464 by 2025.12.18 16:00. On 2025.12.19 15:00 price returned to 1.33571, inside the zone.
In this past example, the entry was a buy at 1.33585, the top of the zone. The stop loss sat at 1.33466 (12 pips of risk), and the target was placed at 1.33824, twice the risk (2.0R). That target was reached on 2025.12.19 16:00. This is a record of what happened on this chart, not an instruction to repeat it.
//Adding an EMA 50 trend filter (GBPUSD)
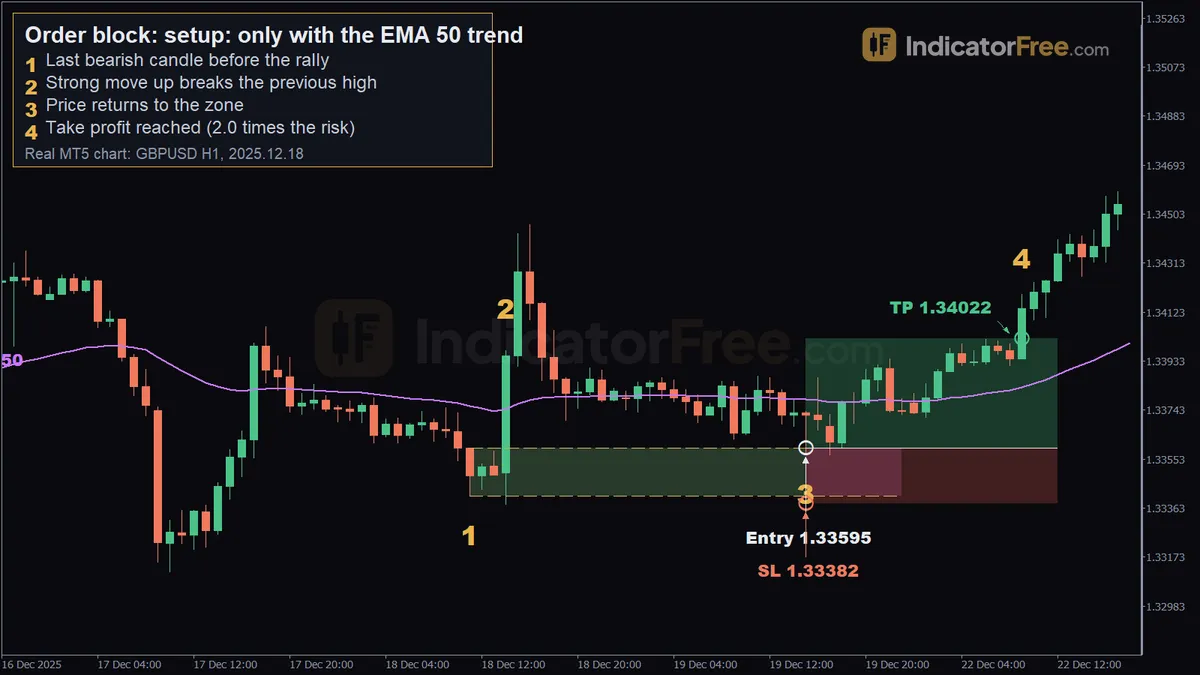
Order block, setup: only with the EMA 50 trend: real GBPUSD H1 MT5 chart (2025-12-18).
A different order block, same pair and similar dates: the last bearish candle closed at 2025.12.18 11:00, with a zone from 1.33409 to 1.33595. Over the next three candles price moved 54 pips and broke the prior 10-bar high, reaching 1.33973 by 2025.12.18 14:00. At the moment this candle closed, price (1.33487) was below the EMA 50 (1.33758). Some traders add a filter like this and only take the setup when price sits on a chosen side of a moving average.
Price returned to 1.33571 on 2025.12.19 15:00. In this past example, the entry was a buy at 1.33595, the stop loss was 1.33382 (21 pips of risk), and the target of 1.34022 (2.0R) was reached on 2025.12.22 09:00.
//Order blocks on gold (XAUUSD)
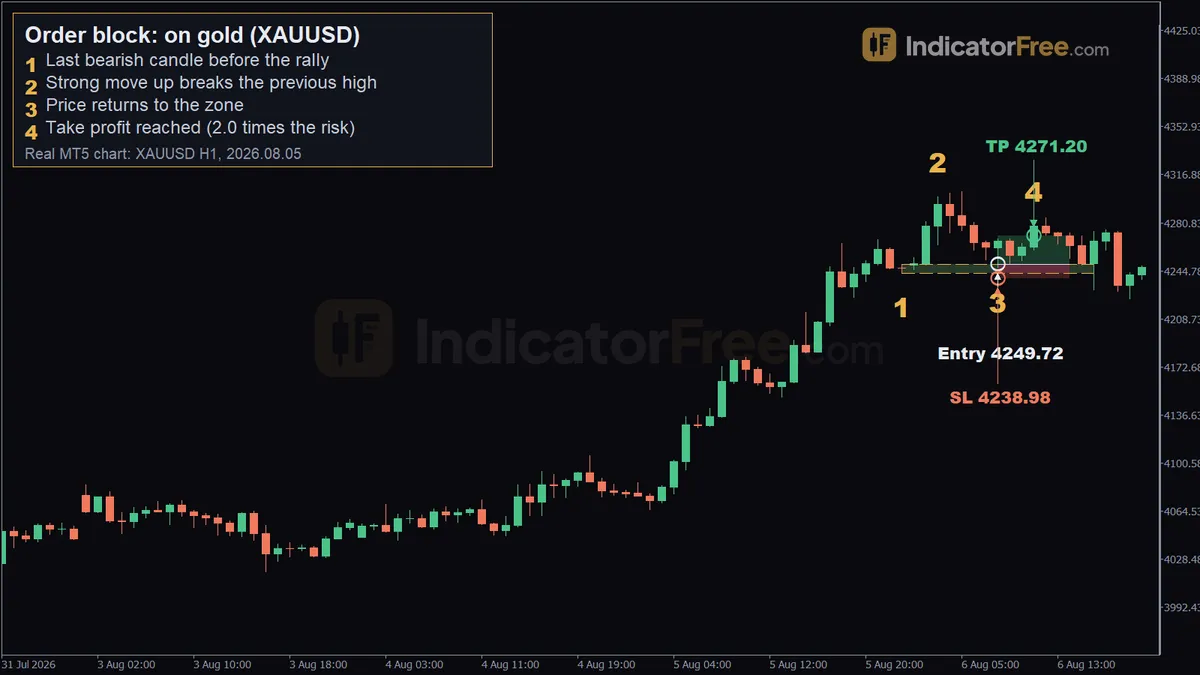
Order block, on gold (XAUUSD): real XAUUSD H1 MT5 chart (2026-08-05).
The same idea applies outside forex pairs. On XAUUSD H1, the last bearish candle before a rally closed at 2026.08.05 23:00, with a zone from 4242.92 to 4249.72. Over the next three candles price moved 51.83 in price and broke the prior 10-bar high, reaching 4300.32 by 2026.08.06 03:00. Price returned to 4247.21 on 2026.08.06 08:00.
In this past example, the entry was a buy at 4249.72, the stop loss was 4238.98 (10.74 in price risk), and the target of 4271.20 (2.0R) was reached on 2026.08.06 11:00. Gold moves in dollars rather than pips, so the same style of zone looks wider in absolute terms than it would on a forex pair.
When order blocks work well, and when to avoid them
| Tends to read better | Tends to read weaker |
|---|---|
| A fresh zone that has not been retested | A zone already touched several times |
| Followed by a clear break of a swing high or low | The move after the candle stalls or reverses quickly |
| Clear trend or swing structure on the chart | A flat, rangebound market with no clear swings |
| Checked against a higher timeframe or a trend filter | Used alone, on one timeframe, with no other context |
| Normal market conditions | Around major news releases, where price can skip straight through a zone |
Practical tips
- Decide upfront whether you mark zones by candle body or full wick-to-wick range, and keep it the same across every chart.
- Don't mark a candle as an order block until the move after it has actually broken a recent swing high or low - without that break it's just a candle.
- Place the stop beyond the far edge of the zone, not just a few pips inside it, so normal noise doesn't take you out early.
- Once price has traded all the way through a zone and kept going, treat that zone as mitigated and stop using it for new entries.
- A trend filter such as the EMA 50 adds context about the broader direction, but it's one more data point, not a rule that removes risk.
- On MT5 you can mark zones by hand with the rectangle tool, or use an indicator that scans swing points and candle ranges and draws the zones for you.
Quick checklist
- Is this the last opposite-colored candle before a fast move?
- Did the move break a recent swing high or low?
- Is the zone still fresh, not already retested several times?
- Has price returned into the zone with a clear reaction?
- Is the stop placed beyond the far edge of the zone?