Exponential moving average
Also called EMA
The exponential moving average (EMA) is a moving average that reacts faster to price changes than a simple moving average, used on MT5 charts to read trend direction and time pullback entries.
The exponential moving average (EMA) is a moving average that puts more weight on recent closes, so it turns faster than a simple moving average when price changes direction. Traders plot it on the price chart to read trend direction, find pullback entries, and build crossover signals with a second EMA.
The EMA formula and what the line actually shows
EMA(today) = Price(today) x k + EMA(yesterday) x (1 - k)
k = 2 / (period + 1)
k is the weight given to the newest close. A short period (say 9) gives k a large value, so each new candle moves the line a lot. A long period (say 200) gives k a small value, so the line barely reacts to any single candle. Because every new value depends on the EMA from the candle before, the line is really a running, weighted average of every close that came before it, with older closes fading out rather than dropping off a fixed lookback window the way they do on a simple moving average.
Reading the EMA 20 on an EURUSD H1 chart
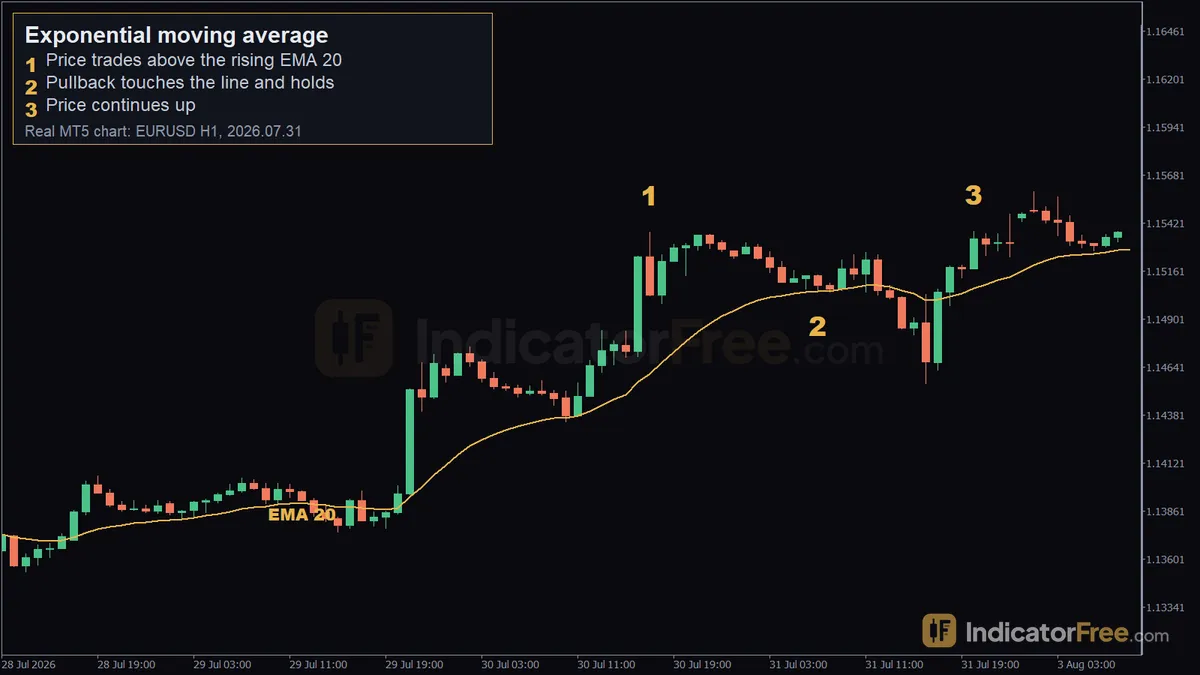
In a past EURUSD H1 example, price was already trading above a rising EMA 20 on 2026.07.30 17:00, with price at 1.1537. The next morning, on 2026.07.31 07:00, the candle's low (1.15044) touched the EMA 20 (1.15049) and the candle still closed back above the line, a pullback that held rather than broke. From there price continued higher, trading at 1.15375 by 2026.07.31 20:00, after closing above the EMA 20 for 15 straight candles while the line itself kept climbing, and rising 29 pips over that stretch. This is a past example, not a prediction: the next pullback to the same EMA 20 can just as easily break through it.
The way to read the line day to day is simple: EMA rising with price above it points to an uptrend, EMA falling with price below it points to a downtrend, and price chopping across a flat EMA points to a range.
When the EMA line is useful, and when to leave it alone
Works well when:
- the market is already trending, with price making higher highs and higher lows (or the opposite in a downtrend) and pullbacks that stay shallow
- you are working on H1, H4 or D1, where the line does not get crossed every few candles
- you are using it to read bias, not as the only signal
Avoid, or use with caution, when:
- price is ranging sideways, the EMA will sit flat and get crossed repeatedly, which looks like signals but mostly is not
- you are on M1 or M5 and reacting to every touch of a short EMA, since a fast EMA also reverses fast
- a high-impact news release is due, a gap can jump straight through the line without any pullback to react to
EMA pros and cons
| Pros | Cons |
|---|---|
| Reacts faster to new price action than an SMA of the same period | Faster reaction also means more false turns in a choppy market |
| Keeps price closer to the line in a trend, giving earlier pullback entries | Still lags the actual turning point, because it is built from past closes |
| Widely watched, so round periods like 20, 50 and 200 often line up with where other traders react | Short EMAs (9, 21) cross often enough to whipsaw, even on H1 |
Trading a pullback to a rising EMA 20
//Pullback entry on EURUSD H1
[IMAGE: EURUSD H1 | facts: EURUSD H1: price closed above the EMA 20 for 15 candles while the line was rising. On 2026.07.31 07:00 the low (1.15044) touched the EMA 20 (1.15049) and the candle closed above it. Price then rose 29 pips in 15 candles. | markers: 1. price trades above the rising EMA 20 (2026.07.30 17:00, 1.1537); 2. pullback touches the line and holds (2026.07.31 07:00, 1.15044); 3. price continues up (2026.07.31 20:00, 1.15375)]
Entry trigger: price has been closing above a rising EMA 20 for a stretch of candles, then a candle pulls back so its low touches the EMA and it still closes back above the line, as happened at 2026.07.31 07:00, when the low (1.15044) touched the EMA 20 (1.15049) and the candle closed above it.
Stop loss (hypothetical): a few pips below the pullback low, so below 1.15044, since a close back under the EMA would undo the reason for the trade.
Exit (hypothetical): either trail the position behind the rising EMA 20 and close when price closes back below it, or take profit once the move covers a similar distance to the 29-pip run seen after this past pullback. Treat that distance as context from one past example, not a target that repeats.
Choosing the EMA period for your trading style
| Style | Timeframe | Period range traders commonly test |
|---|---|---|
| Scalping | M5 / M15 | short, around 9-21 |
| Day trading | H1 | medium, around 20-50 |
| Swing | H4 / D1 | long, around 50-200 |
These are starting ranges to test, not MT5 defaults. On gold (XAUUSD), the Lab's crosses are not consistently more frequent than on EURUSD at the same timeframe, but they do get reversed within 5 candles more often for most EMA pairs (the H1 20/50 pair is the exception, at 14% on XAUUSD versus 16% on EURUSD), so a period that feels right on EURUSD may still need a wider stop on gold.
What the Lab measured
Over 12 months of broker demo data in MT5 (2025-10-02 to 2026-10-02), the IndicatorFree Lab counted EMA crossovers on four symbol and timeframe pairs. This is past data, not a forecast.
| Symbol / TF | Candles | EMA 9/21 crosses | Reversed within 5 candles | EMA 20/50 crosses | Reversed within 5 candles |
|---|---|---|---|---|---|
| EURUSD H1 | 6222 | 22.6/month (271) | 21% | 8.9/month (107) | 16% |
| EURUSD H4 | 1556 | 5.6/month (67) | 19% | 3.3/month (40) | 12% |
| XAUUSD H1 | 5917 | 21.9/month (263) | 24% | 10.4/month (125) | 14% |
| XAUUSD H4 | 1548 | 5.1/month (61) | 28% | 2.8/month (33) | 18% |
The pattern is the same on both symbols: the faster 9/21 pair crosses far more often than the 20/50 pair, and more of those fast crosses get reversed within 5 candles. For the 9/21 pair, moving from H1 to H4 cuts the number of crosses roughly by four on both symbols (EURUSD 271 to 67, XAUUSD 263 to 61); the 20/50 pair drops by a smaller and less consistent amount (EURUSD 107 to 40, XAUUSD 125 to 33).
Practical tips
- Read the slope of the line, not just its position or distance from price. A flat EMA is a weak signal on its own.
- Pair a fast EMA with a slower one (9/21 or 20/50) rather than trading touches of a single EMA in isolation.
- Expect more crosses, and more reversed crosses, on H1 than on H4 for the same EMA pair, per the Lab counts above.
- On XAUUSD, build in extra room around the line. The Lab's reversal rates run higher there than on EURUSD for most EMA pairs, though the raw crossover counts are not consistently higher on either symbol.
- Treat a touch-and-hold at the EMA differently from a clean close through it. The first keeps the trend intact, the second questions it.
- Check what news is scheduled before trading a pullback to the EMA. A gap can skip the line entirely.
Quick checklist
- Is the EMA itself rising (or falling), not flat?
- Did the pullback touch the line and close back on the trend side, rather than closing through it?
- Are you on a timeframe (H1, H4) where this EMA pair does not cross every few candles?
- Is there a news release due that could gap through the line before it reacts?