Order Block Locator
Free Order Block Locator indicator MT5: boxes order blocks, outlines HTF confluence, arrows zone reactions. Lab repaint test: 0 of 16 signals changed.
- Repainted
- 0 / 16
- Signals / week
- ≈ 1.3
- Tested on
- EURUSD M15
- Tested
- 2026-10-03
Overview
Order Block Locator is a free MT5 indicator that boxes bullish and bearish order blocks on your main chart. It outlines the ones that overlap a higher-timeframe block and puts an arrow on the candle that rejects a zone. In the Lab's real-tick repaint test on EURUSD M15, 0 of 16 arrows changed after they appeared.
It is for traders who already plan entries around order blocks and want the zones drawn, cleaned up and alerted for them.
What it puts on your chart
An order block is the last opposite candle before a move that breaks structure. Price often reacts when it comes back to that candle's range.
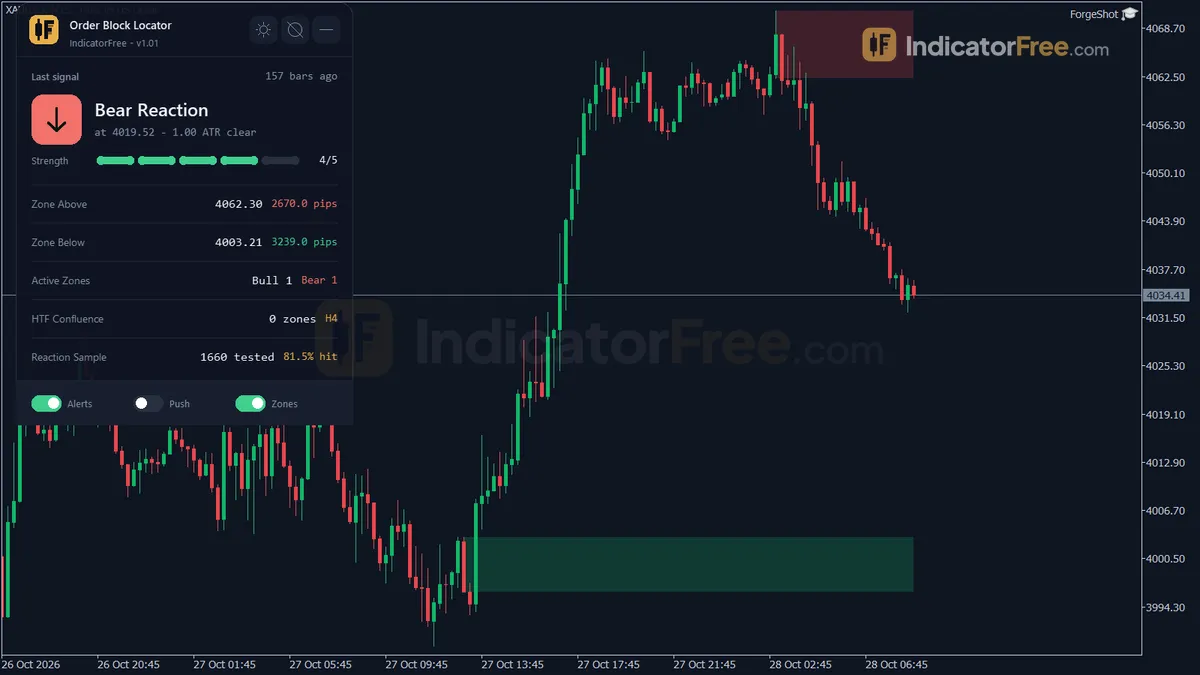
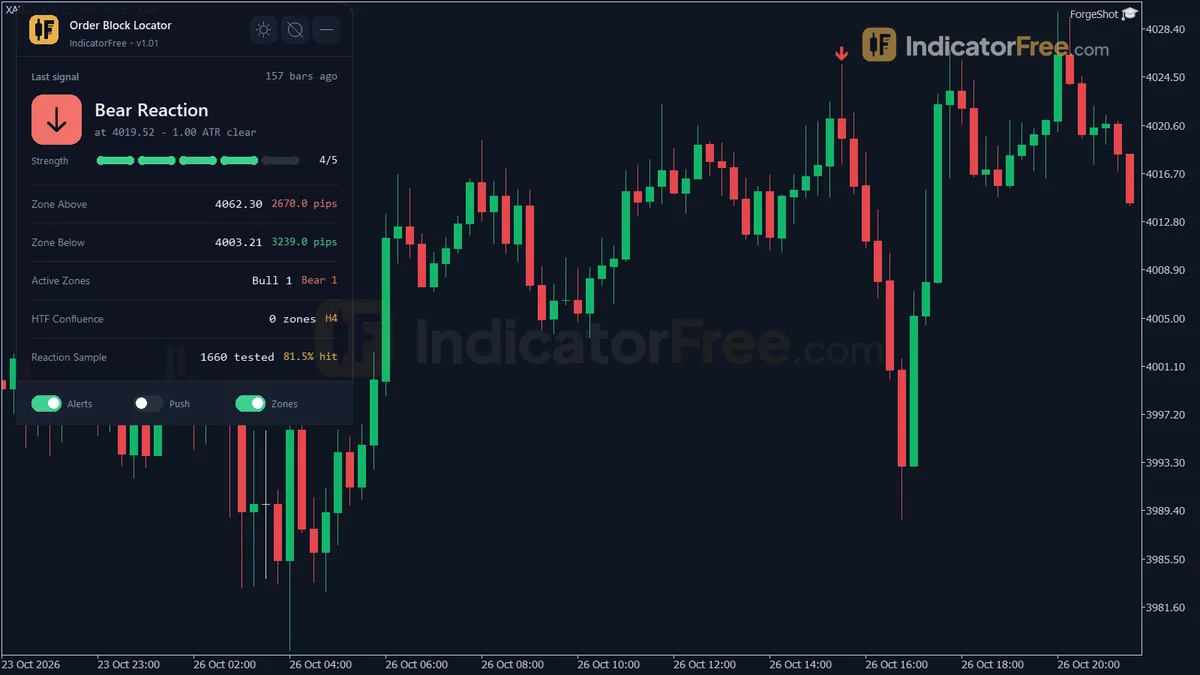
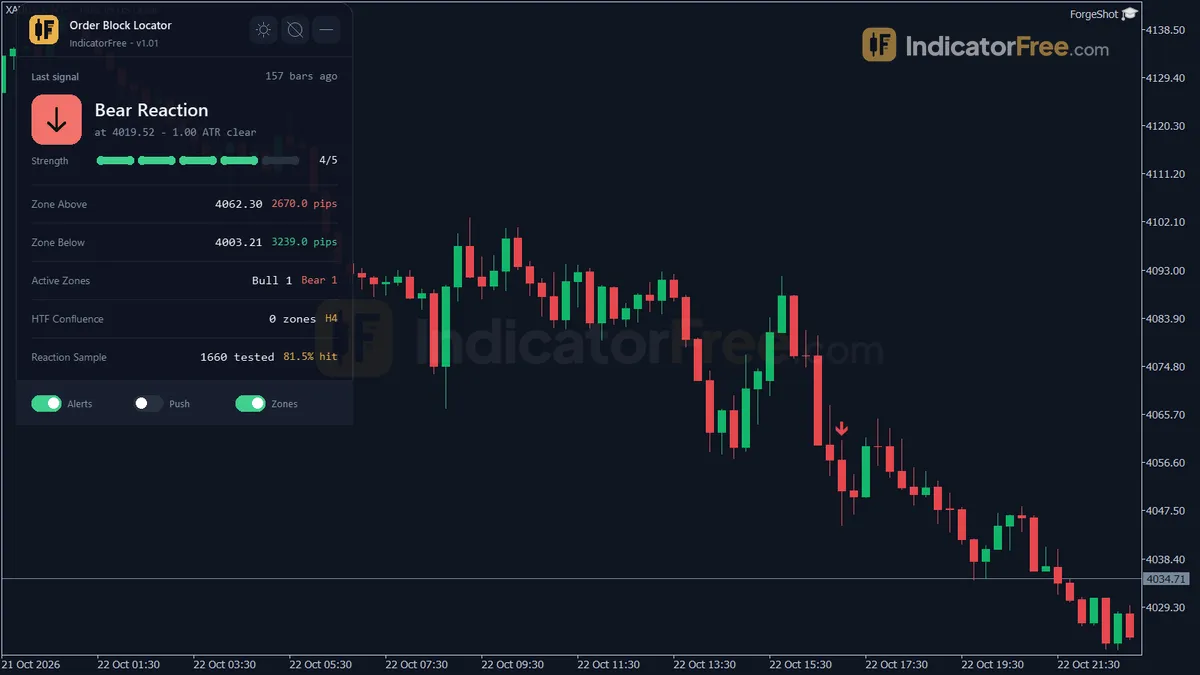
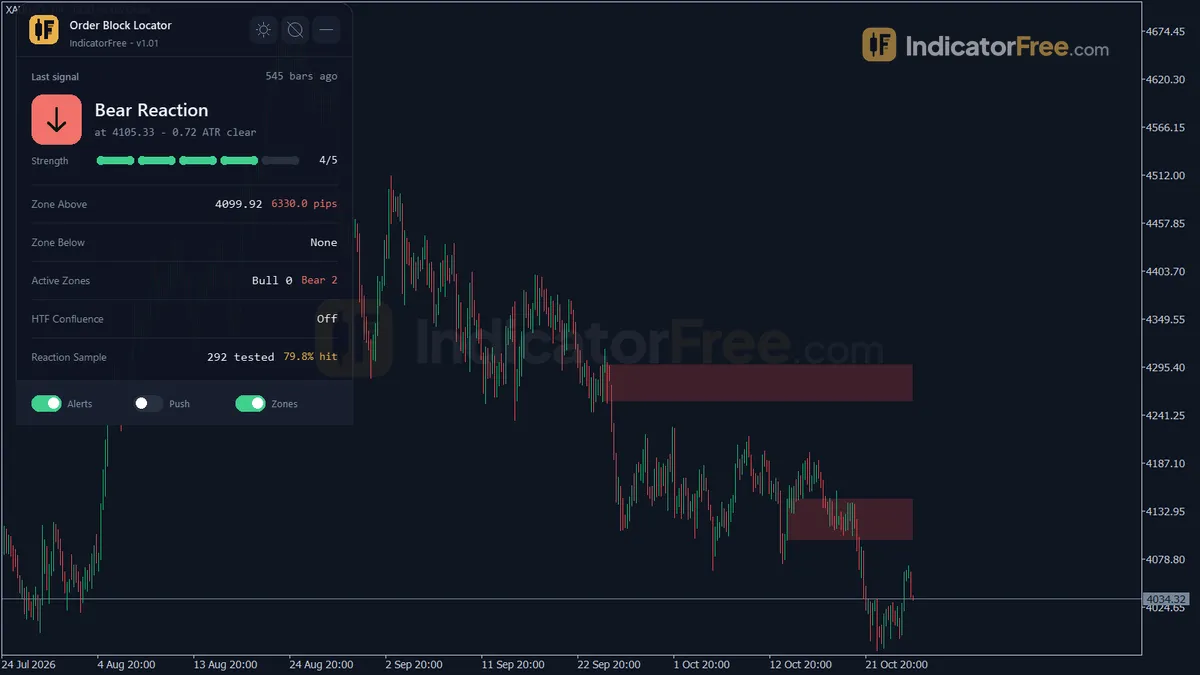
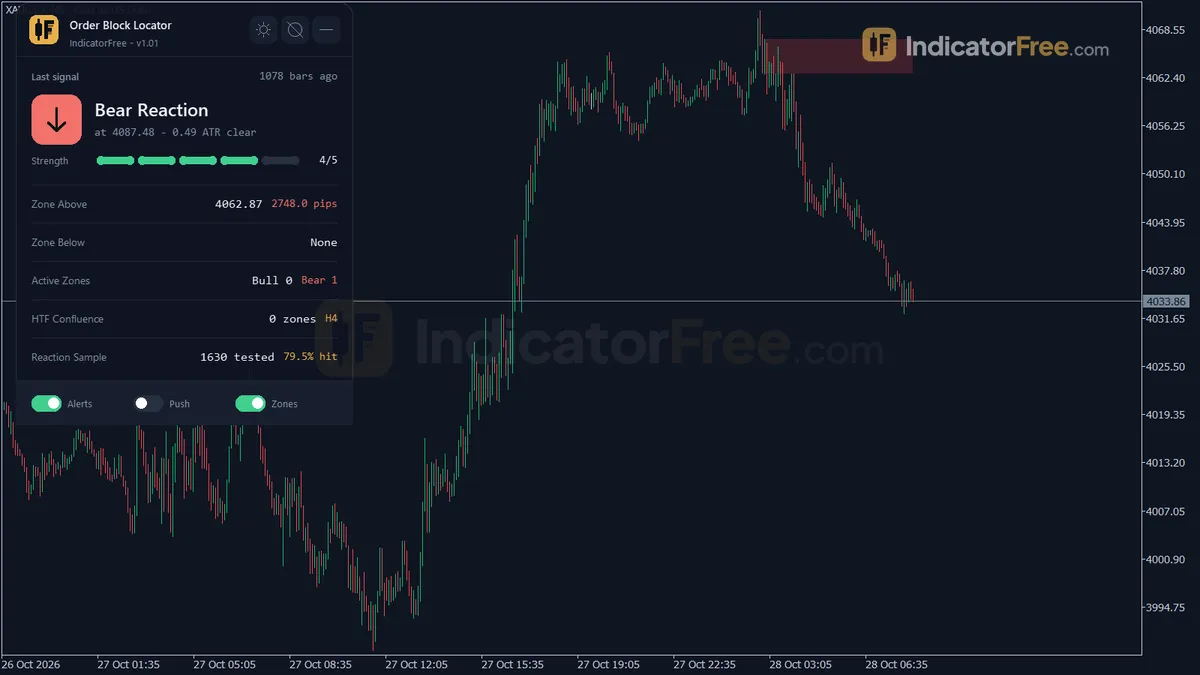
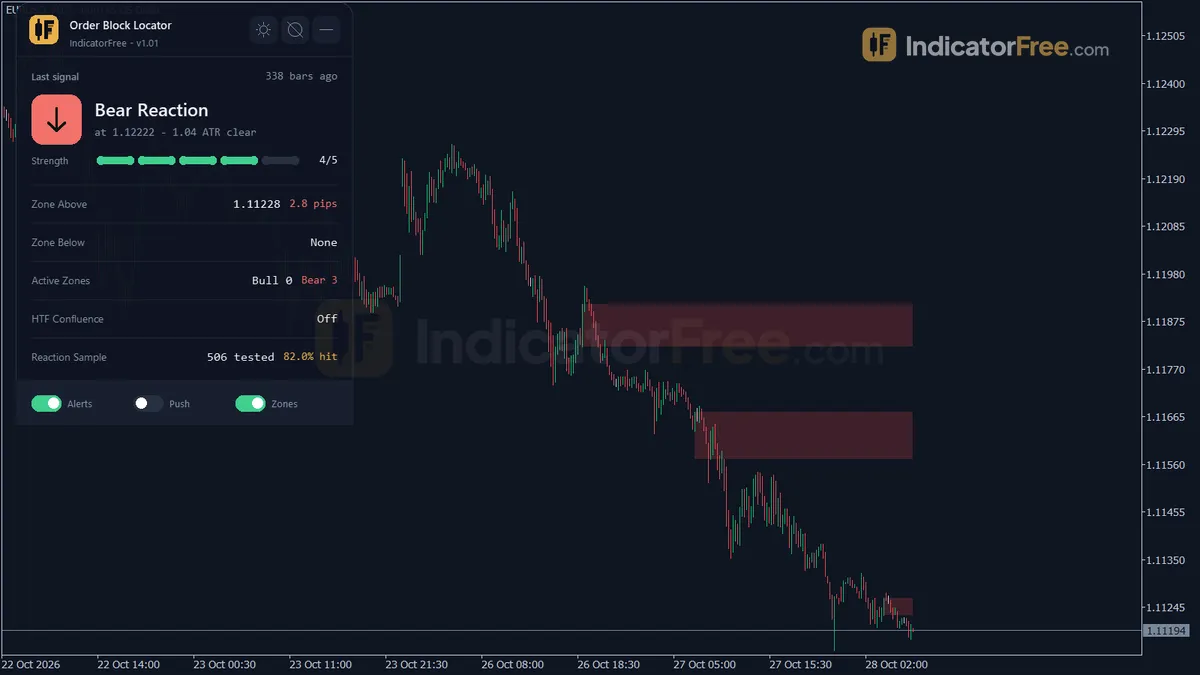
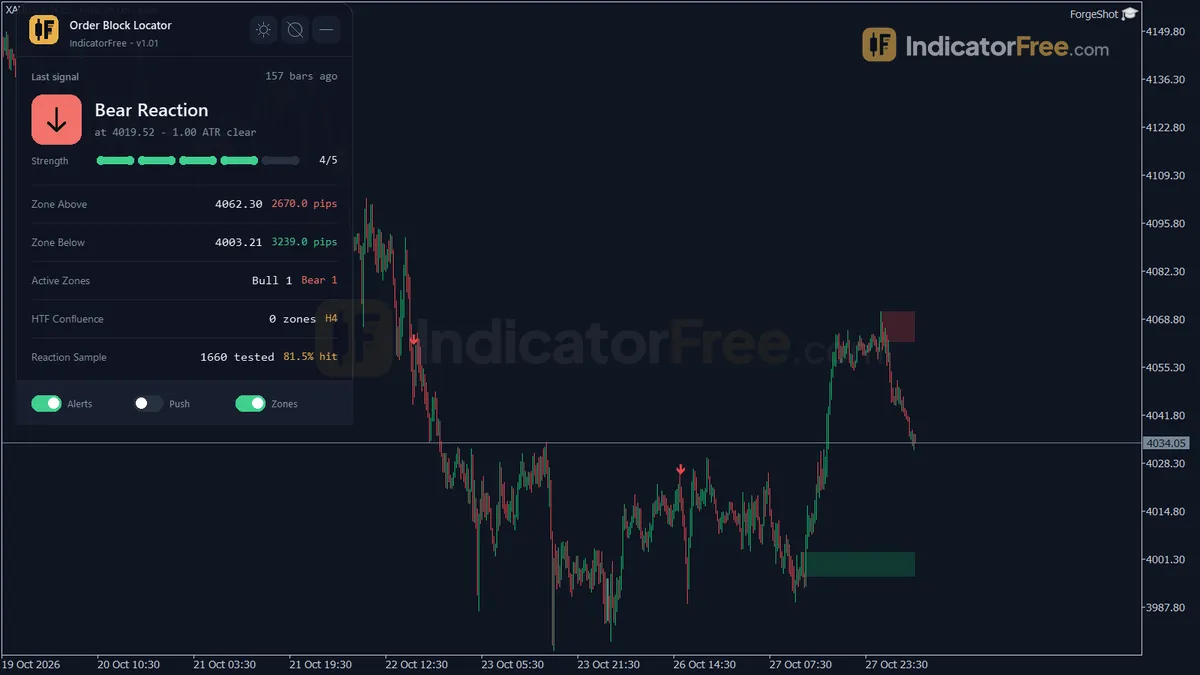
The gallery screenshot Full chart with the tool attached shows the real boxes, arrows and panel from this tool on a live MT5 chart. Everything is drawn in the main chart window, not in a subwindow:
- Bullish/Bearish OB rectangles: the order block zones. A zone is removed when a closed candle closes beyond its far side (or it turns gray if
OnMitigationis set to KeepGray). It is also removed when it gets older thanMaxZoneAgeBars(300) or when it is the oldest zone on a side that has more thanMaxActiveZonesPerSide(3) zones. - HTF Confluence Outline: an outline around a zone that overlaps an active same-direction order block on
HtfTimeframe(H4 by default). The outline goes away once that overlap ends or the zone itself is removed. - Bullish Reaction / Bearish Reaction arrows: a closed candle touched an active zone and closed back out of it in the signal direction.
- Zone Monitor panel: a small on-chart summary, explained in How it works.
How the Lab tested it
The Lab tested version 1.01 (150.5 KB) on MT5 build 6230 on 2026-10-03. The test ran on EURUSD M15 from 2026-07-03 to 2026-10-02 with real ticks from Raw Trading Ltd. It logged every arrow as it appeared and then checked it against the finished history.
Result: 16 signals logged, 0 changed, maximum arrow delay 0 bars. For you, this means the arrows you see in history are the same arrows you would have seen live. Each one shows up when its reaction candle closes, not bars later.
What the signal test found
On the same 16 signals, 62.5% reached 1 ATR in the signal direction before 1 ATR against. That is better than a coin flip, but 16 signals is a small sample. The median time to that result was 2.5 bars. The Lab's "no hit within 20 bars" share was 0% for this sample. With default settings on M15, the tool gave about 1.3 signals per week, so expect few arrows.
The two arrow types did very differently, as the chart below shows:
- Bullish Reaction: 6 signals, 83.3% hit 1 ATR first, median 4.0 bars, about 0.5 per week. This is a strong result on only six signals, so one or two losses would change it a lot.
- Bearish Reaction: 10 signals, 50.0% hit 1 ATR first, median 2.0 bars, about 0.8 per week. That is a coin flip, so this arrow needs a filter before you act on it.
How it works
- 1Feeds closed bars into a zone engine using ATR, swing bars and body-size limits to find order block zones.Inputs: SwingLeftBars, SwingRightBars, AtrPeriod, ObBodyAtrMultiplier, ObBodyAtrCapMultiplier, ZoneBasis
- 2Optionally builds higher timeframe zones and flags a zone as confluence when a same-side higher zone overlaps it.
overlap if zone bottom <= HTF top and zone top >= HTF bottomInputs: ShowHtfZones, HtfTimeframe - 3A bar touching an active zone signals if it closes beyond the zone edge, optionally in the matching candle colour.
Bull: Low <= zone top, High >= zone bottom, Close > zone top (and Close > Open)Inputs: RequireConfirmationCandleColor, SignalOnEveryTouch - 4Strength starts at 2, plus one each for a far close, higher timeframe overlap and first touch. Max 5.
Strength = 2 + [beyond >= 0.25 x ATR] + [HTF overlap] + [first touch], max 5 - 5Tracks each first touch for an ATR-sized move within the lookahead bars, giving a reaction hit rate.
Hit if move >= ReactionSuccessAtrMultiple x ATR within ReactionLookaheadBarsInputs: ReactionLookaheadBars, ReactionSuccessAtrMultiple
Specifications
- Platform
- MetaTrader 5
- Version
- 1.01
- Type
- Indicator
- Window
- Main chart
- Draws
- 2 arrows, 2 zones, 1 panel
- Alerts
- popup, push, sound
- Repaints
- No (0 of 16 signals changed)
- Inputs
- 26
- Tested on
- MT5 build 6230 · 2026-10-03
Repaint test
No repaint detected. In a 3 Jul 2026 – 2 Oct 2026 test on EURUSD M15 (Raw Trading Ltd real ticks), 16 signals were logged at bar close and re-read at the end of the test: 0 changed. Arrows print on the bar that closes the signal, with no delay.
IndicatorFree — tested 2026-10-03 · MT5 build 6230 · Raw Trading Ltd real ticks. Results come from historical data, not live trading, and do not guarantee future results.
Signal statistics
Over 3 Jul 2026 – 2 Oct 2026 on EURUSD M15, the indicator printed 16 arrows. After 62.5% of them, price moved 1×ATR(14) in the arrow's direction before moving 1×ATR against it (median 2.5 bars). 0% reached neither level within 20 bars.
This measures price movement after the arrow, not a trading result. It includes no spread, commission, stop loss or position sizing.
Small sample — not enough to draw a conclusion.
What it draws
- Arrows (Bullish Reaction) from buffer 0, drawn on the closed bar.
- Arrows (Bearish Reaction) from buffer 1, drawn on the closed bar.
- Rectangles (Bullish/Bearish OB) drawn as chart objects, not buffers — they are not readable by iCustom() in an EA.
- Rectangles (HTF Confluence Outline) drawn as chart objects, not buffers — they are not readable by iCustom() in an EA.
- An on-chart panel (Zone Monitor); values shown in the panel are not exposed as buffers.
Inputs
| Input | Default | What it does |
|---|---|---|
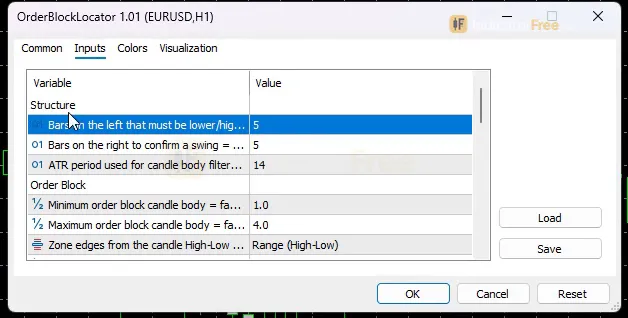
| SwingLeftBars | 5 | Bars on the left that must be lower/higher to confirm a swing (3-15) |
| SwingRightBars | 5 | Bars on the right to confirm a swing = confirmation delay (3-15) |
| AtrPeriod | 14 | ATR period used for candle body filters and offsets (5-50) |
| ObBodyAtrMultiplier | 1 | Minimum order block candle body = factor x ATR |
| ObBodyAtrCapMultiplier | 4 | Maximum order block candle body = factor x ATR (larger gap/news candles are skipped) |
| ZoneBasis | Range (High-Low) | Zone edges from the candle High-Low or Open-Close |
| MergeOverlapZones | true | Merge overlapping same-side zones into one zone |
| MergeMaxHeightAtrMultiple | 3 | Do not merge if the merged zone would be taller than factor x ATR |
| MaxActiveZonesPerSide | 3 | Max active zones per side; the oldest is removed when exceeded (1-20) |
| MaxZoneAgeBars | 300 | Zones older than this many bars expire (50-2000) |
| OnMitigation | Delete | When a candle closes through the zone: delete it or keep it gray until it expires |
| RequireConfirmationCandleColor | true | Reaction candle must close in the signal direction (bullish for buy, bearish for sell) |
| SignalOnEveryTouch | false | false = arrow on the first touch only; true = arrow on every qualifying touch |
| ShowHtfZones | true | Compute order blocks on a higher timeframe and outline zones that overlap them |
| HtfTimeframe | H4 | Higher timeframe (used only when it is higher than the chart timeframe) |
| ReactionLookaheadBars | 10 | Bars after a first touch used to judge the reaction (3-50) |
| ReactionSuccessAtrMultiple | 0.5 | Move in the reaction direction (x ATR) counted as a hit |
| EnableAlerts | true | Popup alert on a reaction signal |
| EnablePushNotification | false | Push notification to the MT5 mobile app on a reaction signal |
| EnableSound | false | Play a sound on a reaction signal |
| SoundFile | alert.wav | Sound file in the terminal Sounds folder |
| AlertOnZoneCreated | false | Also alert when a new order block zone is created (not when merged) |
| Theme | Dark | Chart color theme |
| RestoreTheme | true | Restore the original chart colors when the indicator is removed |
| PanelTheme | Auto (follow chart background) | Panel colors: auto from chart background, dark or light |
| PanelScale | 1 | Panel size factor (0.6-2.0), DPI is applied automatically |
How to read it
Install in one line
In MT5, use File → Open Data Folder, copy the file into MQL5/Indicators, refresh the Navigator and drag Order Block Locator onto your chart.
How a zone forms
The tool reads closed bars only. It confirms a swing with SwingLeftBars and SwingRightBars (5 each). When price breaks that swing, the last opposite candle before the break becomes the zone. That candle's body must be at least ObBodyAtrMultiplier (1) × ATR and at most ObBodyAtrCapMultiplier (4) × ATR, using AtrPeriod (14). The minimum skips tiny noise candles, and the maximum skips gap and news candles.
ZoneBasis sets the zone edges from the candle's High-Low (default) or Open-Close. With MergeOverlapZones on, overlapping zones on the same side merge into one zone, unless the merged zone would be taller than MergeMaxHeightAtrMultiple (3) × ATR.
Reading the arrows
A Bullish Reaction needs a closed candle with Low ≤ zone top, High ≥ zone bottom and Close > zone top. With RequireConfirmationCandleColor on (default), it must also be a bullish candle (Close > Open). A Bearish Reaction is the mirror case: the candle touches a bearish zone and closes below its bottom, as a bearish candle. With SignalOnEveryTouch off (default), only the first touch of a zone can give an arrow.
The illustration below shows the shape to look for:
Common misread: price dips into a zone and you get no arrow. That is not a missing signal. The candle either closed inside the zone, closed in the wrong colour, or it was not the first touch. Also, a gray zone (with OnMitigation = KeepGray) has already been closed through. It is shown only for review, so don't trade it.
The HTF outline
With ShowHtfZones on, the tool also finds order blocks on HtfTimeframe. A chart zone gets an outline when the two overlap: zone bottom ≤ HTF top and zone top ≥ HTF bottom. An outlined zone has a higher-timeframe block behind it, and it adds one point to the signal strength.
The Zone Monitor panel
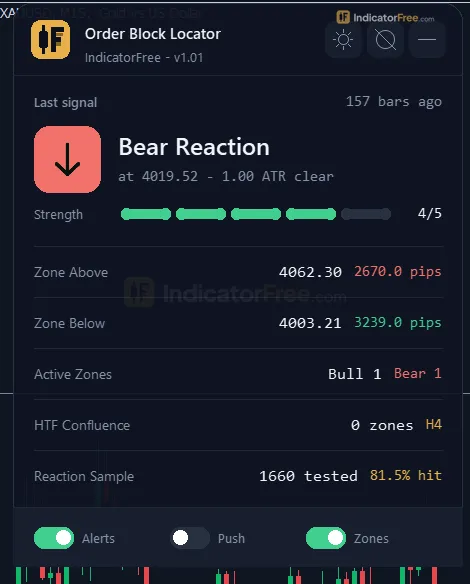
The gallery screenshot The on-chart panel, close up shows the real panel. It lists the last reaction signal with its strength, the nearest zone above and below with their pip distance, the active zone count, the HTF confluence count and the reaction sample hit rate.
Strength runs 2–5: it starts at 2, and gets +1 for a close at least 0.25 ATR beyond the zone, +1 for HTF overlap and +1 for a first touch.
The panel's hit rate is not the Lab's number. It counts a first touch as a hit when price moves ReactionSuccessAtrMultiple (0.5) × ATR within ReactionLookaheadBars (10). The Lab's test needs a full 1 ATR before 1 ATR against, so expect the panel to show a different figure. PanelTheme and PanelScale (0.6–2.0) change the panel's look and size.
What the main inputs change
SwingLeftBars/SwingRightBars: higher values give fewer, larger swings and a longer wait before a zone appears. Lower values give more zones, sooner.MaxActiveZonesPerSideandMaxZoneAgeBars: control how crowded the chart gets.OnMitigation: Delete keeps the chart clean, while KeepGray leaves broken zones visible until they expire.SignalOnEveryTouch: turn it on for arrows on retouches too. This means more arrows, and each one meets a zone that price has already tested.RequireConfirmationCandleColor: turn it off for more arrows, and accept candles that close against the signal.
Alerts
When an arrow prints, EnableAlerts (on) shows a popup in the MT5 alert window. EnablePushNotification (off) sends the alert to the MT5 mobile app, and EnableSound (off) plays SoundFile from the terminal's Sounds folder. AlertOnZoneCreated (off) also alerts when a new zone is drawn, but not when zones merge.
Decision rules
- Bullish Reaction: take it when the zone has an HTF outline (idea, not tested by the Lab).
- Bearish Reaction: act only when the panel shows strength 4 or 5 and the zone has an HTF outline (idea, not tested by the Lab).
- Any arrow: skip it when the nearest opposite zone in the panel is closer than 1 ATR. Take it only if that zone is at least 1 ATR away (idea, not tested by the Lab).
- Time stop: if price has not moved 1 ATR your way within 5 bars, close the trade or move to break-even (idea, not tested by the Lab).
Installation
- 1Download OrderBlockLocator.ex5 from the button above (Google Drive).
- 2In MetaTrader 5: File → Open Data Folder → MQL5 → Indicators. Copy OrderBlockLocator.ex5 there.
- 3Restart MT5 or right-click Indicators in Navigator → Refresh.
- 4Drag Order Block Locator onto a chart. For push alerts, enable "Allow push notifications" under Tools → Options → Notifications.
- Tested on MT5 build 6230.
Key terms and guides
- Trend channel
- A trend channel is two parallel lines drawn along a market's swing lows and swing highs. It marks the sloped zone that price has stayed inside during an uptrend or a downtrend.
- Order block
- An order block is the last candle that closed against the direction of a sharp move that breaks a recent swing high or low. Traders mark that candle's range as a zone where price may come back and react.
- Sideways market
- A sideways market, also called a range-bound market, a trading range or consolidation, is a phase when price moves back and forth between a fairly flat high and a fairly flat low instead of trending.
- Uptrend
- An uptrend is a market where price keeps making higher highs and higher lows: each rally peaks above the last one, and each pullback stops above the previous low.
- Downtrend
- A downtrend is a market move where each swing high and each swing low is lower than the one before it, which shows that sellers are in control.
- Stochastic oscillator
- The Stochastic oscillator is a momentum indicator that compares the current close to the recent high-low range on a 0-100 scale, using %K and %D lines to flag overbought, oversold and momentum-turn signals.
- Guide: Forex Trading for Beginners by Adam Khoo: What It Teaches and How to Use It
- Guide: How to Trade Forex Pairs: A Beginner's Step-by-Step Lesson
- Guide: How to Learn Forex Trading: A 5-Stage Roadmap for Beginners
More on this subject: Price action & SMC guide, terms and tools
User reviews
No reviews yet. Members who download the tool can review it here.
Sign in and download the tool to review it.
Build a checklist with it
Order Block Locator does one job on the chart: zone / level. Put it on the same chart as the tools below and the IndicatorFree panels merge into one checklist card, ordered trend, zone, signal, risk.
- Trend / contextHigh Volatility RegimeAdds the trend side: which way the market leans before you act on Order Block Locator.
- Entry signalChange of CharacterAdds the entry signal: the moment to act once Order Block Locator has set the scene.
The Lab has not tested these combinations. Each tool is tested on its own; the card only lines up what each one says. Free members get 2 new tools a day. If one has to wait until tomorrow, install BlackBox to raise the limit to 5 a day (20 on a live account).
FAQ
Does Order Block Locator repaint?
No repaint detected. In a 3 Jul 2026 – 2 Oct 2026 test on EURUSD M15 (Raw Trading Ltd real ticks), 16 signals were logged at bar close and re-read at the end of the test: 0 changed. Arrows print on the bar that closes the signal, with no delay.
Can I use Order Block Locator in an EA?
Yes. Read buffer 0 (Bullish Reaction) with iCustom() on bar 1 — the last closed bar.
Why can’t my EA read the zones?
Zones and the panel are chart objects, not indicator buffers, so iCustom() does not return them.
How do I get alerts on my phone?
Enter your MetaQuotes ID under Tools → Options → Notifications, tick "Enable push notifications", and keep the push alert input on.
Does it work on other pairs?
Tested on EURUSD only; other symbols not tested.
Is there an MT4 version of Order Block Locator?
This page covers only the MT5 version, which the Lab tested on MT5 build 6230. It will not load in MetaTrader 4.
Can I run it on my Android phone?
The indicator runs in the desktop MT5 terminal. You can still get its signals on your phone: turn on EnablePushNotification and they arrive in the MT5 mobile app.
Why do I see no HTF outlines on my H4 chart?
HtfTimeframe is used only when it is higher than the chart timeframe, and the default is H4. On an H4 chart, set it to D1 or higher to get outlines.
Does it work on gold, indices or other pairs?
Its zones and filters are sized by ATR, so it adapts to each symbol's volatility. The Lab measured it only on EURUSD M15, so test it on your own symbol before you rely on it.
Changelog
- 1.01Initial release: Smart Money order block detection (swing pivot confirmation, Break of Structure, last opposite candle as the order block) with a minimum AND maximum ATR-relative body filter so both noise candles and. · 2026-10-03
Final verdict
The verdict
Order Block Locator is a well-built location tool. It finds order blocks, keeps the chart clean and tells you when price rejects one. Its arrows do not repaint. The bullish arrow looked strong in the Lab test, but the sample is very small. The bearish arrow was no better than chance, so treat it as a reason to look, not as a trade on its own.
What it does well
- Arrows you can trust in history. Because the repaint test was clean, scrolling back gives a fair picture of how the arrows behaved live.
- Tidy zones. The body filter skips noise candles and news candles. Merging, expiry and the per-side limit stop old boxes from piling up.
- Context on the chart. The HTF outline, the strength score and the pip distances in the panel give you the facts you need to filter an arrow without extra tools.
Where it falls short
- Late zones. A zone appears only after
SwingRightBars(5) bars plus a break of structure, so the move that made it is already over. The tool pays only if price comes back. - Thin proof. The Lab tested one symbol on one timeframe over three months. The per-side results rest on single-digit and low double-digit counts.
- No exits. It draws no stop-loss, no target and no trend filter. You set those yourself.
- Few signals. If you want several setups a day, this is not the tool.
Skip it if
Skip it if you trade breakouts or momentum rather than pullbacks, if you need MT4, or if you want a tool that tells you when to exit. The comparison below sums it up:
- –You trade pullbacks into zones
- –You want order blocks drawn and cleaned up for you
- –You are happy with a few setups a week
- –You will add your own stop and target
- –You trade breakouts or momentum
- –You want an arrow you can follow blindly
- –You need MT4 or a phone-only setup
- –You want frequent signals on M15
Settings to start with
Start with the defaults on M15, since that is the timeframe the Lab tested. Set OnMitigation to KeepGray for your first week so you can see which zones failed. On M5, try SwingRightBars 3 and HtfTimeframe H1. This is a starting point the Lab has not tested, so compare it with the defaults on your own history. Turn on EnablePushNotification if you don't watch the chart all day.
A tool to try alongside it
Order Block Locator does not tell you whether structure has turned. Market Structure Shift could act as that filter: for example, take a Bearish Reaction only after a bearish shift. This is an idea to try; the Lab has not tested the pair.