









Stochastic oscillator
Also called Stochastic, Stochastics, Stoch, Slow stochastic, Stochastic indicator
The Stochastic oscillator is a momentum indicator that compares the current close to the recent high-low range on a 0-100 scale, using %K and %D lines to flag overbought, oversold and momentum-turn signals.
A reading above 80 or below 20 is not a signal to trade on its own. Acting on it in a strong trend is the common costly mistake, because price can keep running while the oscillator sits at the extreme. The signal comes from how the %K and %D lines cross once they are there.
Reading the %K and %D lines
The oscillator plots two lines in a separate window under the chart, each with a specific job:
- %K — the main line. It shows where the latest close sits between the lowest low and highest high of the lookback period, as a percentage from 0 to 100.
- %D — a moving average of %K, smoother and slower. It acts as a signal line, similar to the signal line in MACD.
- Overbought zone (80-100) — the close is near the top of its recent range.
- Oversold zone (0-20) — the close is near the bottom of its recent range.
The calculation below shows how one raw %K reading is built, before any smoothing. The prices in it are an illustrative example.
The drawing below shows the two lines moving between the zones, with a %K cross above %D in the oversold zone and a %K cross below %D in the overbought zone. It is an illustration, not a real chart.
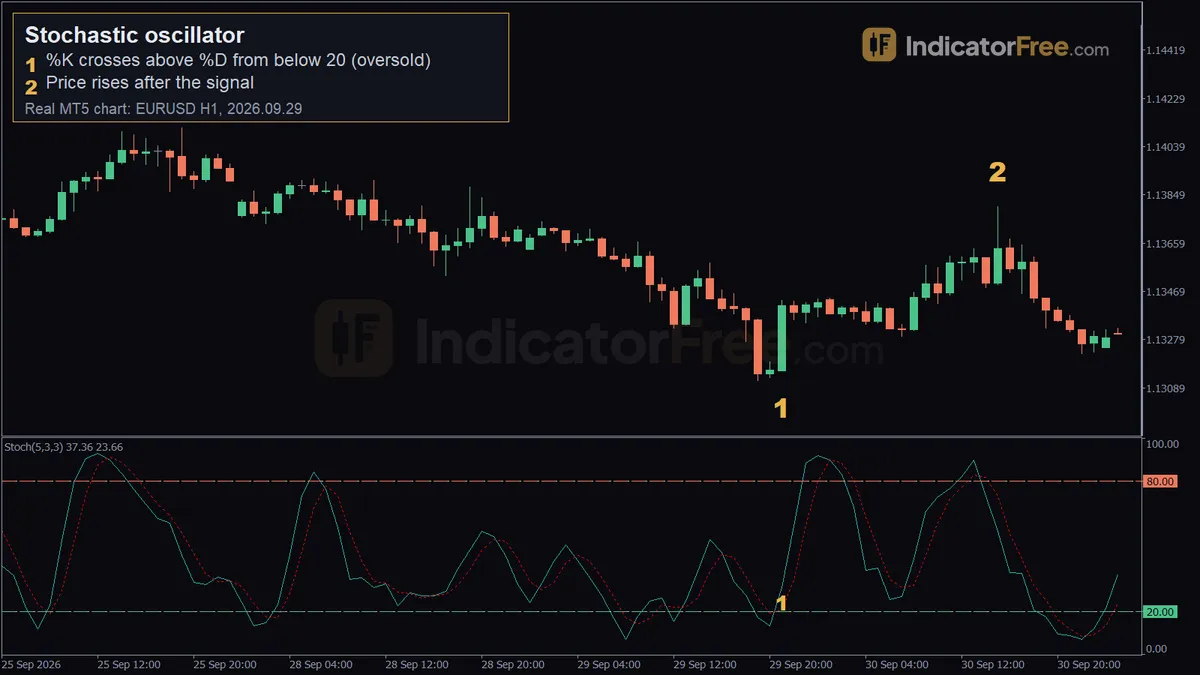
On the EURUSD 1-hour chart at the top of the page, %K dipped below 20 and then crossed back above %D at 1.13157 on 2026.09.29 at 21:00. Price then climbed, and the second marker sits at 1.13803 on 2026.09.30 at 15:00. That is one past example, not a forecast of what the next crossover will do.
Stochastic oscillator inputs and default settings
The Stochastic oscillator has five inputs. The table below lists the MT5 default for each.
| Input | MT5 default | What changing it does |
|---|---|---|
| %K period | 5 | Longer values widen the lookback range, so %K swings less and gives fewer false signals but reacts later; shorter values react faster and whipsaw more. |
| %D period | 3 | Longer values smooth the %D signal line further, making crossovers rarer but later. |
| Slowing | 3 | Adds extra smoothing to %K before %D is calculated. This is what makes the default Stochastic a slow stochastic rather than a raw fast one. |
| MA method | Simple | Switching to an exponential or other method changes how much weight recent candles get in the smoothing. |
| Price field | Low/High | Switching to Close/Close bases the calculation on closing prices only, instead of the full candle range. |
Signals the Stochastic oscillator gives
%K crossing above %D below the 20 line
This is the clearest reversal signal the oscillator gives. Both lines are below 20, then %K turns up and crosses above %D, as in the EURUSD example above.
%K crossing below %D above the 80 line
The mirror signal. Both lines sit above 80, then %K turns down and crosses below %D. After a long rally, it flags that upward momentum is fading, even though price itself may not have turned yet.
Divergence between price and the oscillator
If price makes a higher high but the Stochastic makes a lower high, momentum is not confirming the new price high. The mirror case is price making a lower low while the Stochastic makes a higher low, so downward momentum is fading. This kind of divergence can appear several candles before price actually turns, which is why some traders treat it as an early warning rather than an entry signal on its own.
When the Stochastic oscillator works well — and when to avoid it
Works well when:
- The pair is ranging or pulling back inside a wider trend, so a move into the oversold or overbought zone tends to line up with a real swing low or high in price.
- You wait for the %K/%D cross itself, instead of acting the moment a line touches 20 or 80.
- You combine it with a level — support, resistance, or a zone from another tool — rather than trading the oscillator in isolation.
Avoid it when:
- The market is trending strongly. Price can hug the 80 or 20 line for many candles without reversing, and early crossover signals get run over.
- The timeframe is very low (for example 1-minute) and spread or noise can flip %K and %D back and forth before a real move develops.
- A major news event is due. A single headline can erase a crossover signal in seconds.
Decision rule for a trend: if price is making higher highs and higher lows, ignore crosses above 80 and only take crosses up from below 20 in the direction of the trend.
Pros and cons of the Stochastic oscillator
| Pros | Cons |
|---|---|
| Clear, bounded 0-100 scale makes overbought/oversold easy to read at a glance. | Can stay pinned at an extreme for a long time during a strong trend. |
| Crossovers give a specific, repeatable trigger point. | Short default periods mean frequent small crossovers, some of which reverse immediately. |
| Available on any timeframe and symbol. | Doesn't account for trend direction on its own, so it needs a filter. |
| Free and included as a standard indicator on trading platforms. | Lags recent price because %D is a moving average of %K. |
Practical setups
Buying an oversold crossover on EURUSD 1-hour
This setup uses the EURUSD 1-hour example above.
- Entry trigger: %K crosses above %D while both are below 20.
- Stop loss: a few pips below the swing low that formed the oversold dip.
- Exit: take profit at a prior resistance level, or exit when %K crosses back below %D, whichever comes first. In the example, price had reached 1.13803 by the second marker.
Choosing Stochastic settings for your trading style
| Style | Typical adjustment | Why |
|---|---|---|
| Scalping | Shorter %K period, shorter %D and slowing | Reacts faster to short bursts of momentum, at the cost of more false crossovers. |
| Day trading | Close to the default (5, 3, 3) | Balances speed and noise on 15-minute to 1-hour charts. |
| Swing trading | Longer %K period, longer %D and slowing | Fewer, later crossovers that filter out intraday noise on 4-hour to daily charts. |
These are general tendencies, not fixed rules — test any change before trading it live.
Practical tips for using the Stochastic oscillator
- Widen the %K period if you see constant whipsaw crossovers that reverse within a candle or two.
- Check the price field setting. With the default Low/High, long wicks widen the range, so %K reaches the extremes less often; with Close/Close, wicks are ignored and readings hit 0 or 100 more often.
- Treat divergence as a warning to tighten stops or take partial profit, not as a standalone entry.
Quick checklist:
- Is %K actually crossing %D, not just approaching 20 or 80?
- Is the market ranging rather than trending hard?
- Does the crossover line up with a support or resistance level or zone?
- Is the calendar clear of major news for the next few candles?
Four yes answers: the setup is valid. Any no: skip it.
Not to be confused with: Stochastic RSI
Stochastic RSI applies the Stochastic formula to RSI values instead of to price. It moves faster and more erratically than the plain Stochastic oscillator described here, and its 0-100 scale shows where RSI sits in its own recent range, not where price sits in its high-low range, even though the two indicators share part of their name.
FAQ
Why does the Stochastic stay above 80 while price keeps rising?
The reading only says where the close sits inside the lookback's high-low range. In a steady rise, the highest high moves up with price and each close lands near the top of that range, so %K stays high until closes start falling back toward the middle of the range.
Stochastic oscillator vs RSI — what's the difference?
Both are bounded 0-100 momentum oscillators, but RSI measures the size of recent gains versus losses, while the Stochastic oscillator measures where the close sits inside the recent high-low range. They can disagree on overbought or oversold at the same time, especially on choppy charts.