









RSI
Also called Relative Strength Index, RSI indicator, RSI 14
RSI (Relative Strength Index) is a momentum line from 0 to 100 that compares the size of recent gains with recent losses. Traders use it to spot overbought and oversold moves and to see when momentum is fading.
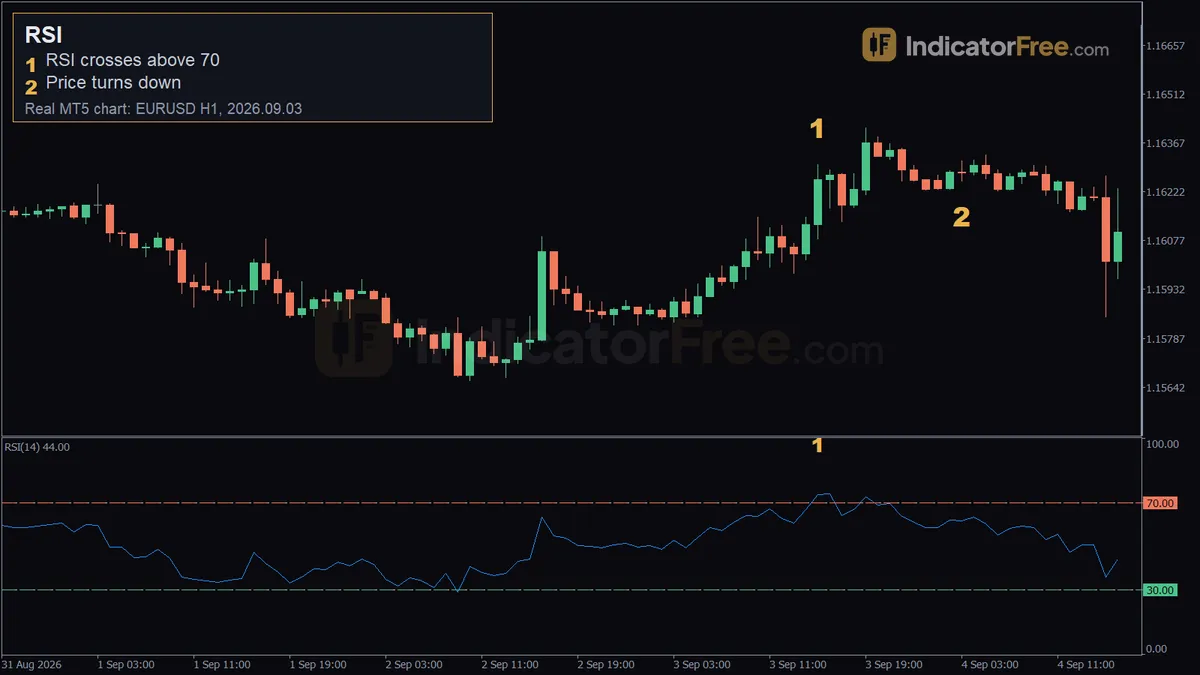
A common way to lose money with RSI is to sell as soon as the line reaches 70 while the market keeps climbing. A reading of 70 is usually not the useful signal. The useful moment is when RSI turns back out of that zone.
How RSI turns gains and losses into a 0-100 number
RSI looks back over a set number of candles, called the period. It averages the closes that went up and the closes that went down. Then it scales the result:
RS  = average gain / average loss
RSI = 100 - (100 / (1 + RS))
When gains are larger than losses, RSI moves toward 100. When losses are larger, it moves toward 0. When gains and losses are equal, RSI is exactly 50. MT5 default settings: period 14, applied to Close.
As an illustrative example, say that over 14 candles the up-closes add up to 420 pips and the down-closes to 140 pips.
After the first reading, each new value uses smoothed averages. The previous average keeps 13/14 of the weight and the newest candle gets 1/14. An ordinary candle moves RSI only a little. One very large candle can move it a lot.
Reading RSI: the 70, 30 and 50 lines and divergence
RSI sits in its own panel below price. Above 70 is called overbought: recent gains have far outweighed losses. Below 30 is called oversold. The 50 line separates up-momentum from down-momentum. In an uptrend RSI tends to stay above 50. In a downtrend it tends to stay below.
A common misreading is to treat 70 as "price must fall now". It only tells you that buyers have been strong. A clearer warning is divergence: price makes a higher high, but RSI makes a lower high. The drawing below shows the shape to look for.
The bullish version is the mirror image: price makes a lower low while RSI makes a higher low.
When RSI helps and when it misleads
When RSI tends to help:
- In ranging markets, where price swings between support and resistance and RSI moves cleanly between 30 and 70. A quick test: if RSI keeps swinging across 50 instead of staying above or below it, treat the market as ranging.
- On 1-hour and slower charts with RSI(14) or a longer period, where crosses of 70 and 30 are less frequent (see the Lab table below).
- When you want an early warning that a move is losing momentum before price turns.
When to be careful:
- In strong trends. RSI can stay above 70 or below 30 for many candles.
- On 1-minute and 5-minute charts, where ordinary price noise pushes RSI across 70 and 30 with little follow-through. A shorter period makes this worse.
RSI pros and cons
| Pros | Cons |
|---|---|
| Fixed 0-100 scale, so readings are easy to read at a glance on any symbol | Overbought and oversold levels behave differently per symbol (see the Lab table) |
| Works the same on forex, gold, indices, stocks and crypto | Built from past closes, so it reacts after price moves |
| Can warn that momentum is fading | Gives no stop loss or profit target on its own |
| Readings on closed candles do not change | Short periods produce many false crosses |
Trading RSI turns out of 70 and 30
Past example: EURUSD 1-hour, September 2026
This is a real past example, not a prediction. On EURUSD 1-hour, on 3 September 2026 at 15:00, RSI(14) rose above 70 to 73.7, with price at 1.16302. Over the next 15 candles, price fell 20 pips. The chart at the top of the page marks both moments: the cross above 70 and the turn lower 12 candles later.
Here the first touch of 70 did come before a 20-pip drop, but price went sideways for about 12 hours first. The turn lower came at 03:00 on 4 September, at 1.16253, only about 5 pips below the price at the cross. That wait is what you have to sit through when you sell the first touch.
Worked example: selling the cross back below 70
The prices in this example are illustrative. In the chart below, RSI climbs through 70 as price rallies, peaks at 78, crosses back below 70 on a red candle, then slides to the 50 line.
- Entry trigger: do not sell when RSI first goes above 70. Wait for a closed candle with RSI back below 70. Here that is the red candle marked "Sell trigger", with RSI at 66, four candles after RSI first rose above 70. You sell at its close.
- Stop loss: a few pips above the highest high of the spike. In the chart, the spike high sits 17 pips above your entry. A stop 3 pips above that high gives a risk of 17 + 3 = 20 pips.
- Exit: close the trade when RSI closes below 50. That happens four candles later, 24 pips below your entry. The gain is 24 pips against 20 pips of risk. This is one example, not a typical result.
The buy version mirrors this. Wait for RSI to close back above 30, place the stop a few pips below the low of the drop, and exit when RSI reaches 50.
Choosing an RSI period for your trading style
| Trading style | Chart timeframe | RSI setting to consider |
|---|---|---|
| Scalping | 5-minute / 15-minute | 14, with 80 and 20 lines |
| Day trading | 1-hour | 14 with 70 and 30: the standard setting |
| Swing trading | 4-hour / daily | 14 or 21. Period 21 gives fewer, larger swings. |
Short charts are already noisy, so on scalping charts use settings that give fewer signals, not more.
A shorter period gives you many more crosses to filter. On EURUSD 1-hour, the Lab counted 25 RSI(7) crosses below 30 per month, compared with 7.2 for RSI(14).
On gold, RSI spent more time above 70 than on EURUSD at every period and timeframe the Lab measured. On XAUUSD, consider a longer period or the 80 line before you treat a reading as stretched.
What the Lab measured on EURUSD and gold
The IndicatorFree Lab counted RSI crosses on 12 months of broker demo data (2025-10-02 to 2026-10-02): EURUSD 1-hour (6222 candles), EURUSD 4-hour (1556), XAUUSD 1-hour (5917) and XAUUSD 4-hour (1548). This is past data, not a forecast.
| Symbol, timeframe | Period | Above 70 / month | Below 30 / month | % candles above 70 | % candles below 30 |
|---|---|---|---|---|---|
| EURUSD 1-hour | 7 | 18.2 | 25 | 10.6% | 12.6% |
| EURUSD 1-hour | 14 | 6.1 | 7.2 | 4.7% | 4.6% |
| EURUSD 1-hour | 21 | 2.8 | 3.6 | 2.3% | 2.4% |
| EURUSD 4-hour | 7 | 4.8 | 6.6 | 10.9% | 15.2% |
| EURUSD 4-hour | 14 | 1.6 | 2.4 | 4.4% | 5.8% |
| EURUSD 4-hour | 21 | 0.6 | 1 | 1.9% | 2.4% |
| XAUUSD 1-hour | 7 | 21.1 | 18.7 | 15.2% | 11.9% |
| XAUUSD 1-hour | 14 | 9.3 | 7.4 | 8.3% | 5.2% |
| XAUUSD 1-hour | 21 | 5.3 | 3.3 | 4.8% | 2.6% |
| XAUUSD 4-hour | 7 | 5.5 | 4.4 | 16% | 10.8% |
| XAUUSD 4-hour | 14 | 3.2 | 1.7 | 9.4% | 5.1% |
| XAUUSD 4-hour | 21 | 2 | 0.7 | 5.1% | 1.9% |
These numbers show how often RSI reached each line. They do not show whether a trade on any of those crosses made money.
The two symbols leaned in different directions. Gold spent more time above 70 than below 30 in every row. EURUSD spent more time below 30 in five of its six rows. On gold, an overbought reading on its own tells you less. On EURUSD, oversold was the more common extreme.
Practical tips for trading RSI
- In an uptrend, look for buys when RSI dips toward 40 and turns up.
- Treat divergence as a stronger warning than a single reading above 70 or below 30.
- Keep one period per timeframe so you can compare today's readings with past ones.
- After major news, wait a few candles before you trust RSI extremes.
- Decide where your stop and exit go before you enter, not after RSI moves.
Quick checklist
- Is the market ranging or trending?
- Has RSI crossed back through 70 or 30 on a closed candle?
- Does a second signal, such as divergence or a support level, agree?
- Is the stop beyond the spike high or low, and is the exit set?
FAQ
Why does my RSI value differ from another chart's?
Check the settings first. A different period or price input changes every reading. If the settings match, the candles may differ. Data feeds and server time zones can open and close candles at different times, especially on 4-hour and daily charts.
Should I use RSI on a closed candle or the live one?
Use the closed candle for decisions. On the live candle, RSI changes with every price tick, so a cross of 70 or 30 can appear and then vanish before the candle closes. Treat the live value as an early alert only, and act once the candle has closed.