









Centerline cross
Also called Midline cross, 50-line cross, RSI 50 cross, Zero-line cross
A centerline cross happens when an oscillator such as RSI, Stochastic, CCI or MACD moves from one side of its middle value (50 or 0) to the other. It signals that momentum has switched from bearish to bullish, or the reverse.
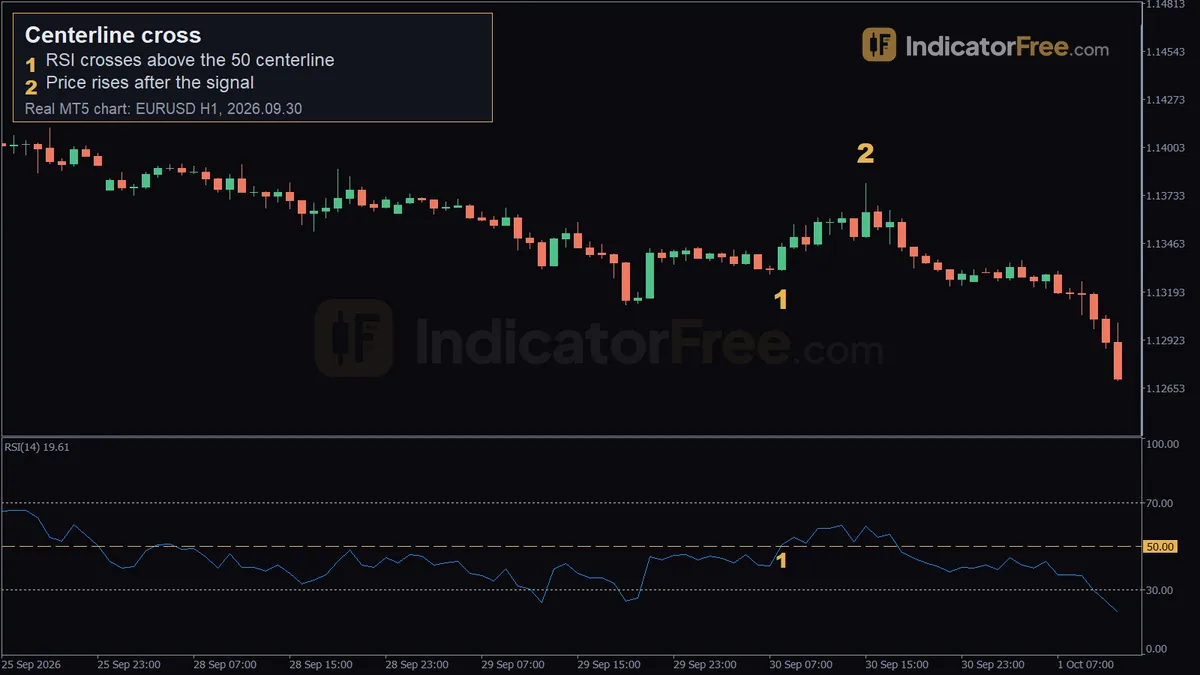
The cross tells you which side is in control right now. It does not tell you whether price has gone too far. Traders who watch only the 70 and 30 lines miss most of what the oscillator shows. The midline helps you stay with a trend, and it warns you before you trade against one.
Where the centerline sits on each oscillator
Each oscillator has its own middle value. Learn the right one before you look for a cross.
| Oscillator | Centerline | A cross above it means |
|---|---|---|
| RSI | 50 | Average gains now outweigh average losses |
| Stochastic | 50 | The close sits in the upper half of the recent range |
| Williams %R | −50 | The close sits in the upper half of the recent range |
| CCI | 0 | Price is above its own recent average |
| MACD | 0 | The fast average is above the slow average |
| Rate of change | 0 | Price is higher than it was a set number of candles ago |
A bullish centerline cross is the oscillator closing above its midline after time below it. Use it to buy or to keep an existing long.
A bearish centerline cross is the oscillator closing below its midline after time above it. Use it to sell or to tighten the stop on a long.
Related crosses have their own entries: zero line (MACD), golden cross and death cross (moving averages), and signal line.
On RSI, the midline matters more than most traders think. Our Lab counted EURUSD on the 1-hour chart from 2 October 2025 to 2 October 2026. In that time, RSI (14) spent 4.7% of candles above 70 and 4.6% below 30. That leaves 100 − 4.7 − 4.6 = 90.7% of candles between the two lines, where 50 is the only reference you have. This is past data, not a forecast.
The chart below runs the same subtraction for three RSI periods. Shorter periods swing faster, which usually means more 50 crosses and more false starts.
Scale zoomed in to show the difference (bars do not start at zero).
How to confirm a centerline cross: 7 checks
- Closed candle. The oscillator closes on one side of the line on one candle and closes on the other side on the next. A cross that happens while a candle is still forming can reverse before that candle closes.
- A real visit to the other side. Before the cross, the oscillator spent several candles clearly away from the line. For a bullish RSI cross, that means a dip into the 40s or lower, not a drift between 49 and 51.
- Some distance. The candle that makes the cross closes clearly past the line. For RSI, wait for a close at 53 or higher, not 50.5 or 51.
- Price agrees. The same candle closes above a recent small swing high for a bullish cross, or below a swing low for a bearish one.
- The bigger trend agrees. The next higher timeframe points the same way, or at least is not pushing hard against you.
- No major news due. A scheduled release can reverse the move within minutes.
- Stop and size set. Your stop sits beyond the swing, and your position size is worked out from that stop distance.
Weak and failed crosses: what to reject
A cross is weak when the oscillator has been flat near the line. In a quiet range, RSI keeps flipping across 50 without ever going anywhere. Each flip looks like a signal, and none of them follows through.
A cross is also weak when it comes late. If price has already run a long way and RSI went from 30 to 50 in one huge candle, much of the move is already behind you.
A cross is broken when the oscillator closes back on the old side within one to three candles and price makes a new swing in the old direction. Treat that as an exit, not as a reason to wait.
In the chart below, the left half shows RSI chopping back and forth across 50 with no follow-through. On the right, RSI first dips clearly below the line and then crosses back above it with room to spare, and stays there.
Reading the EURUSD 1-hour RSI cross from 30 September 2026
The chart at the top of the page is a past example, not a prediction.
Marker 1: at 08:00 on 30 September 2026, RSI (14) crossed above its 50 centerline. Price was at 1.13315.
Marker 2: at 15:00 the same day, price had reached 1.13803. That is 1.13803 − 1.13315 = 0.00488, or about 49 pips above the signal level.
Counted over the full 20 candles after the signal, price ended 36 pips higher. So the strongest part of the move came in the first few hours, and some of it was given back later. The lesson: decide on your exit before you enter, because momentum after a midline cross does not keep going in a straight line.
Trading a centerline cross: entry, stop and target
Setup 1: pullback re-cross in a trend
Price is making higher highs. RSI dips into the 40s during a pullback and then closes back above 50.
- Entry: at the close of the candle that makes the cross.
- Stop loss: just below the low of the pullback.
- Target: the previous swing high first, or twice the distance to your stop.
Setup 2: first cross out of a range
Price has moved sideways while RSI hugged 50. Then a candle closes above the range high, and RSI closes above 50 on that same candle.
- Entry: at that candle's close.
- Stop loss: back inside the range, below its middle.
- Target: the height of the range, added to the breakout level.
Here is an illustrative example with round numbers for Setup 1. You have a $10,000 account and risk 1% per trade. You buy EURUSD after the cross. Your stop goes below the pullback low, 25 pips under your entry, and your target is twice your risk. On a USD-quoted pair, one standard lot of 100,000 units is worth $10 per pip.
If RSI closes back below 50 before the target is reached and price breaks the pullback low, the stop takes you out for $100. The size of the loss was set before you clicked buy.
When the centerline cross works and when to skip it
It works best when price is trending and pulling back in steps. It also helps when a range is ending and the cross lines up with a price breakout.
Skip it in tight sideways markets, in the quiet hours before a session opens, and right before high-impact news. In those conditions the line gets crossed again and again, and every cross costs you the spread.
Two habits keep the signal usable:
- Choose one oscillator period and keep it. Changing the period after a loss just changes where the false signals appear.
- Gold's RSI swings to the extremes more often in our Lab data (RSI (14) on the 1-hour chart, 2 October 2025 to 2 October 2026: 9.3 moves above 70 per month on XAUUSD vs 6.1 on EURUSD; past data, not a forecast), so expect more whipsaw. Size your positions for more stop-outs, not bigger ones.
| Pros | Cons |
|---|---|
| Simple yes/no rule on a closed candle | Lags price, because the oscillator is built from past candles |
| Keeps you trading with momentum, not against it | Many false crosses in flat markets |
| Same idea works on RSI, CCI, MACD and others | Says nothing about how far the move will go |
| Easy to combine with swing highs and lows for stops | A late cross can mean entering after the move is done |
FAQ
Which oscillator gives the most reliable centerline cross?
None is reliable on its own. They are all built from recent prices, so their crosses often land close to each other. Pick one whose centerline you understand from the table above, and judge each cross with the checks, not by the indicator's name.
Do centerline crosses work on the 1-minute or 5-minute chart?
They appear far more often there, and most of them are noise. The move after a cross on a 1-minute chart is often only a few pips, so the spread you pay to get in and out eats a much larger share of it than on a 1-hour chart.