









Pullback
Also called Retracement, Pullback entry, Dip, Countertrend move
A pullback is a short, temporary move against the main trend: price dips during an uptrend or rallies during a downtrend, then turns back the trend's way. Traders use it to enter a trend at a better price.
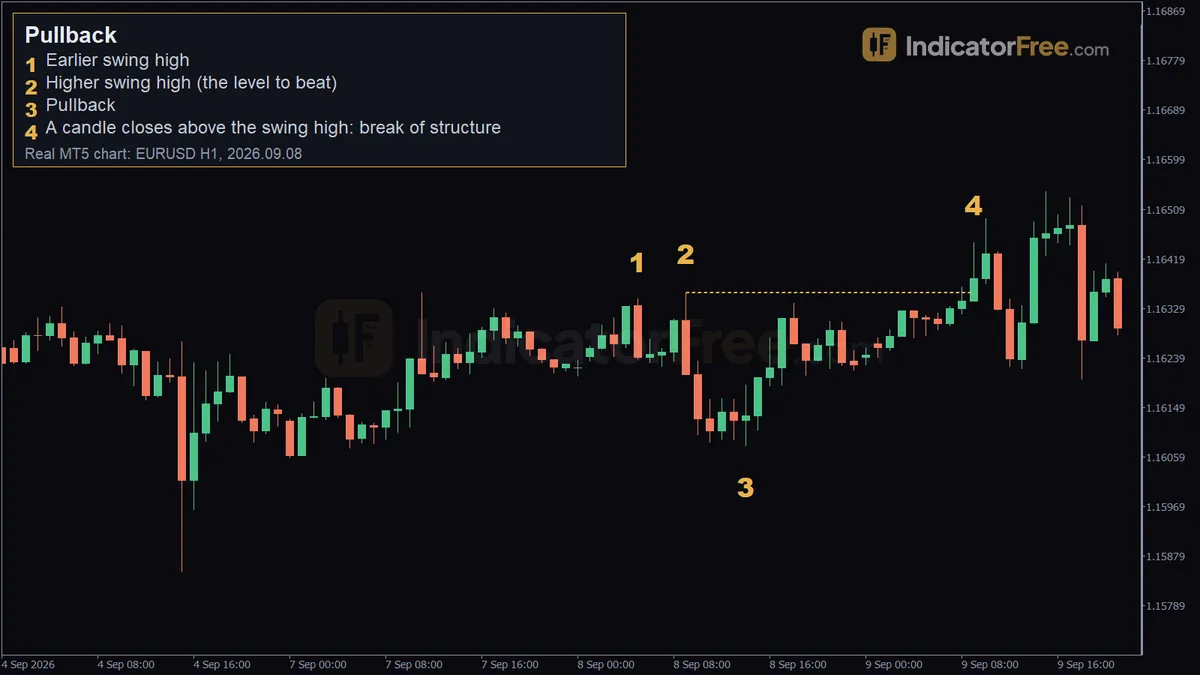
A pullback matters because it decides two things: where you enter and where you put your stop. Buy after the pullback and your stop can sit close, below the pullback low. Buy at the top of a spike and your stop has to sit far away. The costly mistake is treating a real reversal as a pullback and buying into a falling market.
How to identify a pullback: a 6-point checklist
Work through these in order. If one fails, you are not looking at a clean pullback.
- A trend is in place. In an uptrend you need at least two higher highs and a higher low. Without a trend, a dip is just noise in a range.
- Price has just made a new swing high. A swing high is a peak with lower highs on both sides of it. The pullback starts from that peak.
- The move against the trend is smaller than the move before it. A healthy pullback gives back part of the last up-leg, not all of it.
- The last higher low holds. In an uptrend, the pullback low must stay above the previous swing low. This is the line between a pullback and a broken trend.
- The pullback candles are weaker. They are usually smaller and more overlapping than the candles of the push that came before.
- The trend resumes with proof. The cleanest proof is a candle that closes above the swing high. Traders call this a break of structure: the trend has printed a new higher high.
The chart below shows all six points in one uptrend.
Healthy pullback or broken trend: how to tell
A valid pullback passes all six checks above; then buyers step back in.
A weak pullback is still technically valid but harder to trade. It goes deep, close to the last higher low, or it drifts sideways for a long time. The deeper it goes, the less room is left between your entry and the level that would prove you wrong.
A broken pullback is no longer a pullback. Use this rule: if a candle closes below the last higher low in an uptrend, stop looking for buys. The trend structure has failed and the move may be a reversal. In a downtrend, the same rule applies to a close above the last lower high.
The drawing below shows the three cases side by side.
If the move against the trend is faster and larger than the trend legs before it, treat it as a warning, not a discount.
The EURUSD 1-hour pullback, marker by marker
The chart at the top of the page is a past EURUSD 1-hour example, not a prediction.
- Marker 1, earlier swing high: on 2026.09.08 at 05:00, price peaked at 1.16346.
- Marker 2, the level to beat: at 09:00 the same day, price made a slightly higher swing high at 1.16358. A higher high keeps the uptrend intact. It also sets the level the trend must clear later.
- Marker 3, the pullback: by 14:00, price had dipped to 1.16080. That is 1.16358 − 1.16080 = 0.00278, or 27.8 pips against the trend.
- Marker 4, break of structure: on 2026.09.09 at 09:00, a candle closed at 1.16383, above the 1.16358 high. Marker 4 is drawn above that candle at 1.16449; the number that matters is the close, 1.16383. The close above the swing high is what confirmed the pullback had ended.
Note the order. The pullback only became "a pullback" in hindsight, once the close above 1.16358 arrived. Until then, it was just a dip that could have kept going.
The markers show one higher high (marker 2 over marker 1) and the break of structure. The swing low before marker 1 is not marked, so checklist points 1 and 4 cannot be confirmed from this picture alone. On a live chart, find that earlier swing low and check that the pullback stayed above it before you act. If you cannot point to it, you cannot place your stop or tell a pullback from a reversal.
Pullback entry: trading the break above 1.16358
The entry here waits for confirmation instead of guessing the bottom. The following figures use the real prices from the chart, plus an illustrative position size and target.
- Entry: buy on the close of the candle that broke the swing high, 1.16383.
- Stop loss: below the pullback low of 1.16080. Once price closes above the swing high, the pullback low becomes the new higher low, so that is where the stop goes. If price falls under it, the setup is wrong. For clean arithmetic the example places the stop at 1.16080 exactly; in practice you add a small buffer.
- Target: two times the risk (2R) above entry.
A 0.10 lot is 10,000 units, so each pip on EURUSD is worth $1. Scale the lot size so the stop distance equals the amount you accept to lose on one trade.
The cost of waiting for the break: your entry is above the pullback low, so the stop is wider than if you had bought the dip itself. The benefit: you only enter once the trend has proved itself.
When pullback trading works and when to stand aside
Pullbacks work best in a clear trend with regular swings, where each leg makes a new high and each dip holds above the last one. They also work better when the higher timeframe points the same way as the timeframe you trade.
Stand aside in sideways markets, where every "pullback" is just a move inside a range. Avoid them just before big scheduled news, when one candle can wipe out the structure. Be careful late in a long trend: pullbacks get deeper and the swings get messy as the trend tires.
| Pros | Cons | |
|---|---|---|
| Entry price | Better price than chasing a breakout candle | You may miss the move if no pullback comes |
| Stop placement | Clear stop below the pullback low | Deep pullbacks force a wide stop |
Bullish and bearish pullbacks
A bullish pullback is the dip in an uptrend that this whole page walks through: buy on a close above the swing high, stop below the pullback low.
A bearish pullback mirrors every rule. The downtrend needs lower highs and lower lows, and price must have just made a new swing low. The rally against the trend must stay below the last lower high. The trigger is a close below the swing low, and the stop goes above the rally high.
Pullback trading tips from the chart
- Wait for the close, not the touch. In the EURUSD example, the close at 1.16383 above 1.16358 was the signal. A wick that pokes above the swing high and closes back below it is not a break of structure.
- Skip pullbacks with no room. If the target is closer than the stop, the trade does not pay for its risk.
FAQ
What is a complex pullback in trading?
It is a pullback that moves in two or more legs instead of one: a dip, a small bounce, then a second dip. It takes longer and often goes deeper. Treat the second leg's low as the pullback low, and still require the last higher low to hold.
Do pullbacks work the same way in crypto trading?
The structure is the same: trend, swing high, dip, break of the high. Crypto markets often move faster and further in each swing, so pullbacks tend to be deeper and stops need more room. Use the same method as the EURUSD example: money at risk ÷ stop distance = position size. A wider stop with the same money at risk gives a smaller position; if the stop doubles, the position halves.
Where should I place a limit order if I want to buy inside the pullback?
Two common spots are about halfway into the last up-leg, or lower, near the area where that leg started, just above the last higher low. The halfway level fills more often, but the stop below the last higher low is further away. The deeper level gives a tighter stop but fills less often. If the order never fills and price closes above the swing high, cancel it: either take the break entry described above or wait for the next pullback.