









ADX
Also called Average Directional Index, Average Directional Movement Index, ADX indicator
ADX (Average Directional Index) is a trend-strength indicator that scores from 0 to 100 how strongly price is trending, in either direction, while its +DI and -DI lines show whether buyers or sellers are in control.
A trend trade opened while price is only drifting has little behind it. ADX gives you a number to check before you risk money. If it is low, the move behind your setup has little strength, and the next swing the other way is more likely to stop you out.
Reading the ADX, +DI and -DI lines
ADX sits in a separate panel under the price chart as three lines. All three come from one calculation, which compares each candle's high, low and close with the candle before it.
- ADX line: trend strength only, not direction. Below about 20, price is drifting. Rising through 25, a trend is building. Above 40, the trend is strong.
- +DI (positive directional indicator): how much of the recent movement came from pushes to new highs. When +DI is on top, buyers are in control.
- -DI (negative directional indicator): the same reading for pushes to new lows. When -DI is on top, sellers are in control.
The sketch below shows three phases you will see again and again: a range, a trend and a fading trend.
ADX signals and what each one tells you
No single line is a signal on its own. Each reading below combines the ADX level with which DI line is on top.
ADX rising above 25 with +DI on top: strong uptrend
Buyers are in control and their control is growing. Look for the gap between +DI and -DI widening candle by candle. The EURUSD example in the next section is this signal.
ADX rising above 25 with -DI on top: strong downtrend
This is the mirror case: sellers are in control and gaining. A common misread is to treat a high ADX as bullish. A selloff with ADX at 40 is a strong downtrend, so always check which DI line is on top before you pick a direction.
ADX below 20: no trend to follow
The DI lines may cross back and forth, but there is little strength behind any of those crossings. Trend-following entries here tend to get stopped out by the next swing the other way.
+DI and -DI crossing: control changing hands
A crossing is an early warning, not an entry. Wait until ADX starts rising after the crossing. That shows the new side has real strength behind it. Taking a crossing while ADX is flat or falling is a common mistake.
ADX turning down from a high level: the trend is slowing
A high reading alone does not mean the trend is about to end. The turn is what matters. When ADX peaks and starts to fall, the trend is still in place but losing pace. It is a signal to tighten your stop or take part of your profit. It is not a reason to trade the other way, because price often goes sideways for a while before any reversal.
Trading an ADX uptrend: a past EURUSD 1-hour example
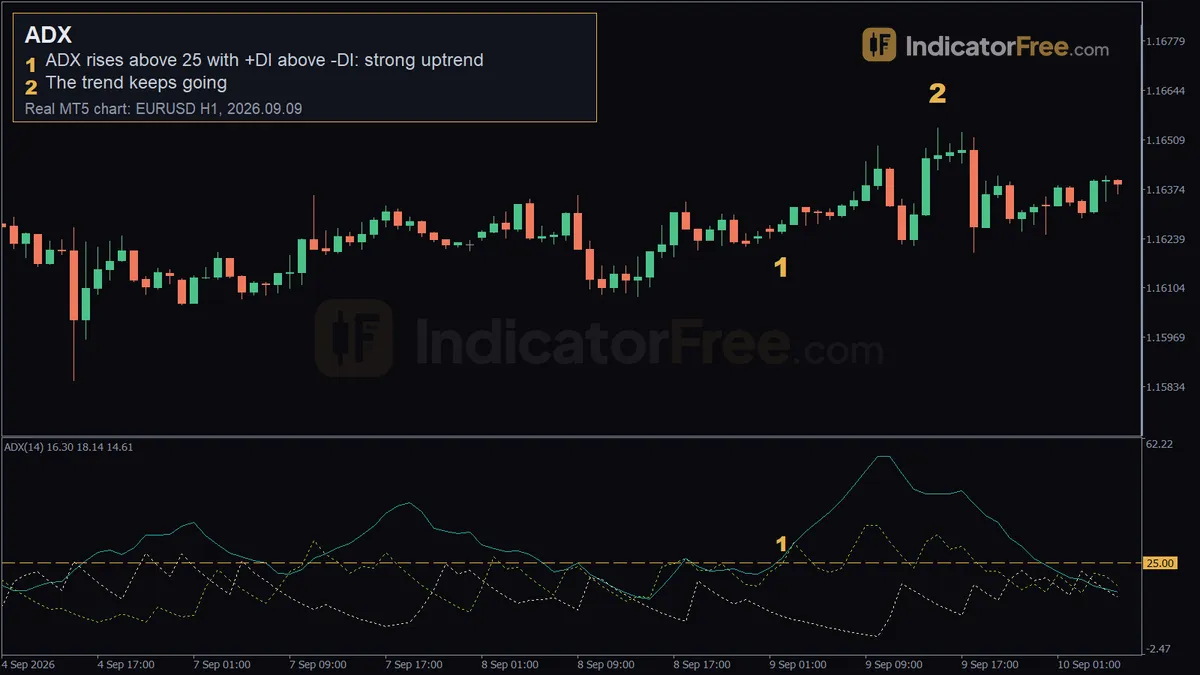
This is a past trade on the EURUSD 1-hour chart, used here to apply the rules above. It is not a forecast. The chart at the top of this page shows this trade: marker 1 is the 02:00 entry at 1.16252 and marker 2 is 15:00 at 1.16541.
EURUSD long on 9 September 2026: ADX 26.4, +DI 24.5, -DI 9.1
- Entry trigger: at 02:00 on 2026.09.09, price was 1.16252. ADX(14) read 26.4 and was rising, just through 25. +DI read 24.5, far above -DI at 9.1. Strength and direction agreed, so this was the rising-above-25-with-+DI-on-top signal, not a bare DI crossing.
- Stop loss: ADX gives no stop level. Place the stop just below the last swing low before the entry candle, then size the trade from that distance. As an illustrative example: if that low were 20 pips away and you planned to risk $50, you could risk $50 ÷ 20 = $2.50 per pip. A standard lot of 100,000 EURUSD is worth $10 per pip, so that is $2.50 ÷ $10 = 0.25 lots.
- Exit: set two rules before you enter. First, if ADX peaks and turns down while +DI drifts back toward -DI, tighten the stop or take part of the profit. Second, if -DI crosses above +DI, close whatever is left.
Here is what happened next. At 15:00 the same day, 13 candles after entry, price was 1.16541. That is 28.9 pips above entry (1.16541 − 1.16252 = 0.00289). The trend was still running and neither exit rule had fired, so you would still hold the full trade.
Twenty-five candles after entry, price was 26 pips above the entry price. It had slipped about 3 pips from the 15:00 level but was still well in profit.
You did not need to catch the low. You needed proof that buyers were in control and that their control was growing, and ADX gave you that at 02:00.
Predicting the next ADX reading from the DI gap
The ADX line is a smoothed average of a raw reading called DX. DX is the gap between the two DI lines divided by their sum, times 100. That gives you a simple rule: ADX keeps rising for as long as DX stays above it, and starts falling once DX drops below it. If the DI gap holds, the next reading will be higher.
Here is the rule applied to the EURUSD entry above.
The panel below shows the same idea as a picture. DX runs above the ADX line, and ADX climbs toward it, crossing 25 on the entry candle.
Only the last point comes from the EURUSD chart. The earlier values are an illustrative lead-up showing how ADX climbs while DX stays above it; the lead-up is a sketch, so its steps are not exact Wilder averages.
You can go one step further. With the original Wilder smoothing, each new ADX keeps 13/14 of the old value and adds 1/14 of the new DX. If the DI lines held steady, a Wilder-style estimate of the next reading is (26.4 × 13 + 45.8) ÷ 14 ≈ 27.8. That is not what the EURUSD chart printed next. The platform behind that chart uses an exponential average that reacts faster, so its own next value will differ. Only the direction is the same.
You can also check this by eye. A wide, widening DI gap means ADX has further to rise. Once the DI lines drift back toward each other, ADX is about to level off, even if it still prints high numbers.
Choosing an ADX period for your trading style
ADX has one input, the period. It uses each candle's high, low and close, so there is no price type to choose. The MT5 default is a period of 14, which drives all three lines.
| Period | What changing it does | Suits |
|---|---|---|
| 7-10 | All three lines react faster, with more DI crossings and more false readings in choppy price | Scalping |
| 14 | Balances speed and reliability on 15-minute to 1-hour charts | Day trading |
| 15-20 | Filters intraday noise and focuses on moves that last several days | Swing trading |
| 21-30 | Smooths the lines, so signals come later but much of the noise is gone; fits 4-hour and daily charts held for weeks | Position trading |
These ranges are common practice, not fixed rules. On more volatile markets such as gold, keep the period at the top of your range or require ADX to hold above 25 for several candles. On major FX pairs, the first clean close above 25 with a widening DI gap is usually enough.
When ADX helps and when to leave it off
ADX works well:
- On a market making sustained moves in one direction during its busy trading hours.
- As a filter on a trend-following entry from another tool, so you skip entries when there is no trend.
- On forex, gold, stock indices and individual stocks alike, because it only needs highs, lows and closes.
Avoid relying on it:
- Right after a major news release, when price can spike both ways before any trend forms.
- As your only reason to enter. ADX measures strength. It does not give you an entry price.
ADX pros and cons
| Pros | Cons |
|---|---|
| One strength rule covers both longs and shorts, because ADX ignores direction | Lags price, because it is built from past highs, lows and closes |
| The lines are smoothed, so a single odd candle rarely flips the reading | Can stay high well after a trend has started to slow |
Using ADX as a filter for moving-average entries
ADX tells you whether to trade a trend. A moving average tells you where to get in. Together they make a simple routine:
- Check the filter: ADX above 25 and rising, with the DI line on top pointing your way.
- If the filter is on, take pullback entries to the moving average in that direction only.
- If ADX drops below 20, stand aside until it recovers.
This cuts out many of the whipsaw crossings that moving averages give in sideways markets.
Practical tips for trading with ADX
- Read the slope before the level. A rising 22 tells you more than a flat 30.
- Treat 25 as a zone, not a switch. A reading of 24 and a reading of 26 are not meaningfully different.
- Check the next timeframe up. Trade only when ADX there is above 20 with the same DI line on top as your trade.
- Never widen your stop because ADX is high. A strong reading does not change the money you planned to risk.
Quick ADX checklist before a trend trade
- ADX above 25 and rising, not just high?
- The DI line on top matches my direction, with the gap widening?
- DX still above ADX, so ADX can keep rising?
- Stop beyond the last swing, with size set from my planned risk?
ADX vs the Directional Movement Index
Traders often use ADX and DMI as if they were the same thing. The Directional Movement Index (DMI) usually refers to the +DI and -DI pair, and ADX is the strength line built from them. If an indicator labelled DMI shows only two lines, you are missing the strength reading. If one labelled ADX shows a single line, you are missing the direction.
FAQ
Can I use ADX to pick an options strategy?
Options traders read ADX on the price chart of the underlying stock or index, not on the option itself. A strong reading points to a directional position, and ADX below 20 points to strategies that suit a range. ADX says nothing about the option's own price.
What ADX value means a trend is too late to join?
No single value marks it, so use a rule instead. If ADX is above 40 and has fallen for two candles in a row, do not open a new trade in the trend direction. Wait until ADX drops back and then turns up again with the same DI line on top, and enter on that fresh rise.
What does it mean when ADX is above 50?
One side has controlled price for many candles in a row, so the trend is very strong. It is not a signal to trade the other way. By then, much of the move is usually already behind you. The last swing is often far from price, which means a wide stop and a smaller position for the same planned risk.