









Trend strength
Also called Trend intensity, Directional strength
Trend strength is how forcefully and steadily price moves in one direction. Traders often measure it with the ADX indicator: readings above 25 point to a strong trend, and readings below 20 point to a weak or sideways market.
Knowing the direction is only half the job. Trend strength tells you whether a dip is a chance to join the move or the start of a range that will chop up your stop. It also tells you when to stop trading the trend at all.
How to spot a strong trend: the identification checklist
Check these in order, then count the checks that pass. 5–6 = strong, trade pullbacks. 3–4 = forming, watch only. 0–2 = no trend, skip trend trades. You cannot score Strong unless check 4 (ADX above 25 and rising) passes.
- Structure: price makes clear higher highs and higher lows in an uptrend, or lower highs and lower lows in a downtrend.
- Shallow pullbacks: price retraces less than half of the last swing before it pushes on.
- Candle bodies: candles that move with the trend have bigger bodies than candles that move against it.
- ADX above 25 and rising. ADX (Average Directional Index) is a line from 0 to 100. It measures how strong a move is, not which way it goes.
- Directional lines apart: +DI measures buying pressure and -DI measures selling pressure. In a strong uptrend +DI sits well above -DI. In a strong downtrend it is the other way round.
- Moving average slope: the moving average you already use (for example a 50-period average) points clearly up or down, and price stays on one side of it.
Reading ADX levels to choose your tactic
Use the ADX reading to decide which kind of trade you are allowed to take. These levels are standard textbook guides, not exact laws.
| ADX reading | Status | What it usually means | What you do |
|---|---|---|---|
| Below 20 | No trend | No real trend, price drifts or ranges | Skip trend trades. Range tactics or no trade |
| 20 to 25 | Forming | A trend may be forming | Watch only. Wait for confirmation. Open trades: keep, stop under the last higher low |
| Above 25 and rising | Strong | Strong trend in progress, with the leading DI line clearly ahead and swings still moving the same way | Trade pullbacks in the direction of the DI leader |
| 25 to 40 and falling | Slowing | The trend is still there but losing speed | Hold open trades. No new entries until ADX rises again |
| Above 40 and turning down, or above 40 and flat while the DI gap shrinks | Weakening | A strong trend is losing pace | No new entries. Hold open trades with tighter stops |
| Any reading, if the DI lines cross or price closes beyond the last higher low (lower high in a downtrend) | Broken | The condition you entered on is gone | Close open trend trades. No new ones |
Use the table for the ADX status; you still need 5–6 checklist passes before you trade.
In the illustrative chart below, ADX stays under 20 while the market moves sideways. It climbs through 25 as the trend gets going. Here ADX tops out near 36 and then turns down as the push stalls, so this turn matches the Slowing row (25 to 40 and falling), not the Weakening row above 40. Watch the gap between +DI and -DI: it widens as ADX climbs past 25. Near the top, the gap starts narrowing first, and ADX turns down soon after.
One misread is very common. A falling ADX does not mean price is reversing. ADX dropping from 36 to 29 only says the move is slowing. As long as it stays above 25 and the DI lines have not crossed, the trend is still there.
The EURUSD 1-hour example, marker by marker
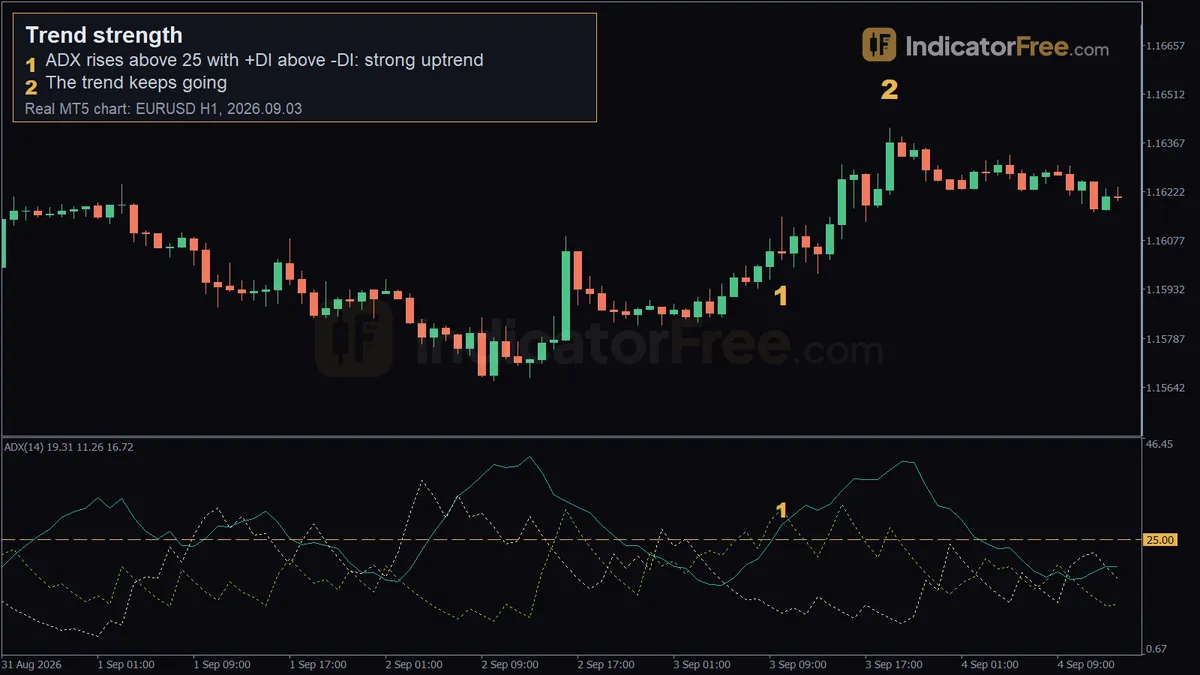
The chart at the top of the page is a past example from the EURUSD 1-hour chart. It shows what happened then. It is not a prediction.
Marker 1 (2026.09.03 10:00, 1.16019): ADX(14) rose above 25 to 28.1. +DI was 31.6 and -DI was 9.4. That is a gap of 22.2 points (31.6 − 9.4), so buyers were clearly in control. The ADX side of a Strong reading was all there: ADX above 25, ADX rising, and a wide DI gap.
Marker 2 (2026.09.03 19:00, 1.16411): nine candles later, the trend was still going and price was higher. Measured from the 10:00 close (1.16041), price rose 37 pips to the 19:00 high (1.16411). Marker 1 is drawn at that candle's low (1.16019), which is why the two markers are about 39 pips apart.
Notice what the reading did not do. It did not call the top or give a target. It told you the trend was worth trading in its direction during that window. The markers show the strength condition only, not a trade entry, so do not try to place the pullback setup below on this chart.
Trading a strong trend: a pullback setup with stop and target
The setup is simple. Check these entry conditions first:
- ADX above 25 and rising.
- The leading DI line clearly ahead and pointing your way.
- Higher lows (or lower highs) still intact.
- The checklist scores 5–6 (Strong).
Then wait for a pullback toward a recent swing level or a moving average. Enter when a candle closes back in the trend direction. Put the stop beyond the pullback low (or high in a downtrend) and set your size from 1% risk. Aim for at least twice your risk.
Here is an illustrative example with round numbers. You have a $10,000 account and risk 1% per trade. On EURUSD the stop sits 25 pips below entry, and one standard lot (100,000 units) is worth $10 per pip.
If ADX drops under 20, the DI lines cross, or price closes below the last higher low (above the last lower high in a downtrend), close the trade by hand. The reason you entered no longer holds. Between 20 and 25, keep the trade but move the stop under the last higher low. Never add to a position just because ADX keeps climbing. Add only on a new pullback that holds.
When trend strength helps and when to avoid it
Works best:
- On liquid pairs during active sessions.
- After a clear breakout.
- When the 1-hour and 4-hour charts agree.
Avoid it:
- In the minutes around major news, when ADX can jump on a single spike.
- In thin holiday markets.
- Right after a long range, when ADX is still catching up.
| Pros | Cons |
|---|---|
| Tells you which tactic fits right now (trend or range) | ADX lags, so it confirms a trend after it has started |
| Same rules on any pair or timeframe you chart | Gives no entry price, stop or target by itself |
| Rules are clear numbers, easy to apply the same way every time | Readings differ by timeframe: the 1-hour chart can be strong while the 4-hour chart is flat |
| Keeps you out of choppy markets that eat stops | Falls during healthy pauses, which can shake you out early |
FAQ
What ADX period should I use for trend strength?
14 is the most common setting and the one used in the example above. A shorter period reacts faster but gives more false readings. A longer period is smoother but lags more.
Can price trend while ADX is below 20?
Yes, price can keep making higher lows while ADX stays under 20. A slow grind with small candles keeps the DI lines close, so ADX stays low. Treat it as an unconfirmed trend, not a strong one, and score it with the checklist.