









9 EMA
Also called EMA 9, 9-period EMA, 9-day EMA, 9 exponential moving average
The 9 EMA is a 9-period exponential moving average: a line that averages recent candle closes and gives the newest ones the most weight. Traders use it to read short-term momentum and to time pullback entries in a trend.
A 9-period line reacts within a few candles, so it shows a change in momentum early. It also gets crossed often. If you treat every cross as a signal, you pay the spread and take small losses again and again, so the skill is knowing which touches count.
What the 9 EMA measures and how fast it reacts
An exponential moving average (EMA) is a running average of price that counts recent closes more heavily than old ones. With a period of 9, the newest close gets a weight of 2 ÷ (9 + 1) = 0.2. The previous value of the line keeps the other 0.8.
That gives you a rule you can check by eye: on every candle, the 9 EMA moves one fifth of the distance between itself and the latest close. The figures below are an illustrative example, with a new candle closing 50 pips above the line.
Price jumped 50 pips and the line moved 10. A wide gap between price and the 9 EMA therefore means price has run ahead of its own average. Buying there puts you far from the line that would tell you the move has failed.
The period counts candles, not days. On a 1-hour chart the last nine closes, which is the last nine hours, carry about 87% of the line (1 − 0.8^9); the rest comes from older candles. On a daily chart the same share comes from the last nine trading days.
Rules for identifying a 9 EMA trend
- The line slopes clearly up or down. A flat line is not a trend.
- Candles close on one side of the line for a run of candles, not for one or two.
- Pullbacks reach the line, or come close, and the candle closes back on the trend side.
- Each push after a pullback makes a new high in an up move, or a new low in a down move.
- A slower average, such as the 20 or 21 EMA, slopes the same way.
Bullish version: all five rules hold with the line sloping up, and you look for buys only. Bearish version: flip every rule: the line slopes down, rallies reach the line and close back below it, and you look for sells only.
A valid touch versus a broken 9 EMA
A valid touch is a wick that reaches or pierces the line while the candle closes on the trend side and the line keeps its slope. The wick shows the test. The close shows who won it.
A touch is weak when the line has gone flat, or when price closed on both sides of it in the last few candles. That is a sideways market, and the 9 EMA has nothing to say there.
The line is broken when a candle closes fully on the other side and the next candle does not reclaim it. The common misread is counting a wick through the line as a break. Judge the close, never the wick.
The drawing below shows both cases with candles and wicks. The green circle marks a lower wick that pierces the 9 EMA while the candle closes above it. The red ellipse marks a candle that closes below the line, then a next candle whose high stays under it.
The gold 1-hour example, marker by marker
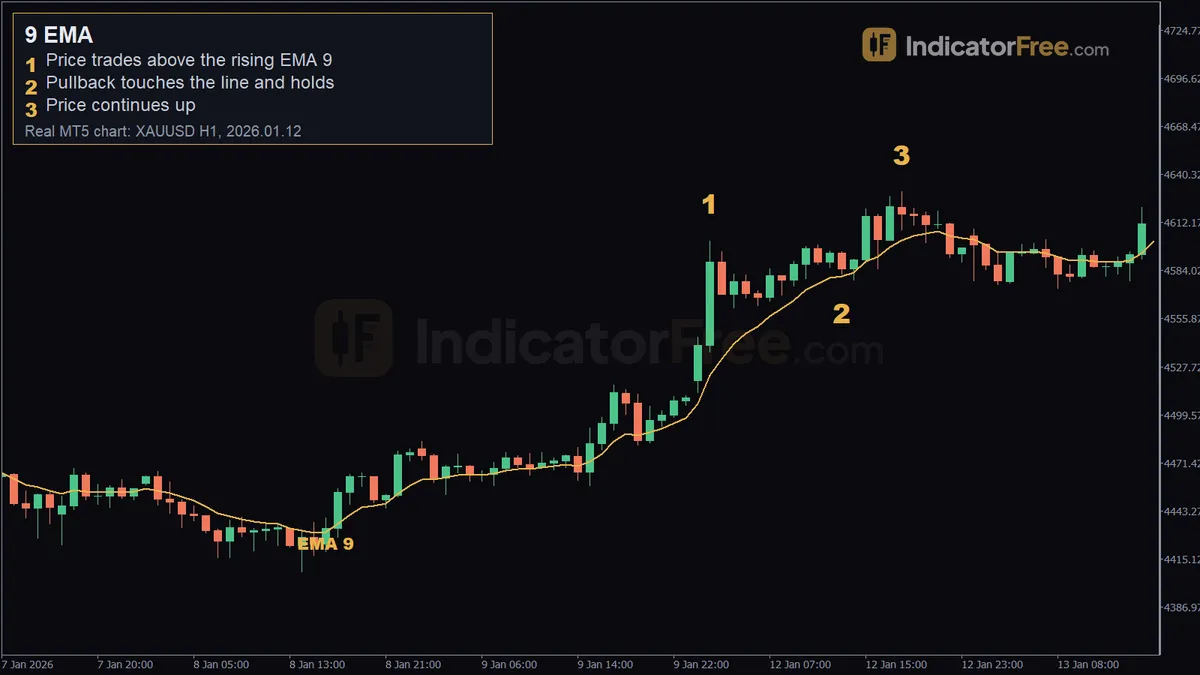
The chart at the top of the page is a past example on gold (XAUUSD) 1-hour candles with the 9 EMA drawn on it. It shows what happened then, not a prediction.
- Marker 1 (12 January 2026, 02:00, 4601.2): price trades above a rising 9 EMA. In the run before the pullback, price closed above the rising 9 EMA for 15 candles, which covers rules 1 and 2.
- Marker 2 (12 January 2026, 13:00): the pullback. The candle's low at 4581.84 touched the 9 EMA at 4580.83, and the candle closed above the line, at 4585.22. That is a valid touch.
- Marker 3 (12 January 2026, 18:00, 4630.22): price continues up. From the touch candle's close at 4585.22 to the high at marker 3 (4630.22), price rose 45.00 in price.
Trading the pullback to the line
Pullback-and-hold on a rising 9 EMA
Entry: you do not buy the touch itself. You wait for the pullback candle to close above the 9 EMA, then buy at the open of the next candle.
Stop loss: below the pullback low, with a few pips of room for the spread. If price trades under that low, the touch has failed and the reason for the trade is gone.
Target: set it before you enter, at twice the distance from your entry to your stop. If price stalls before the target, exit on a full close below the line that the next candle does not reclaim.
In the illustrative 9 EMA chart below, measured in pips from your entry, the pullback wick dips through the rising 9 EMA, and the candle closes above the line. You buy at the next open and place the stop a few pips under the pullback low, 10 pips below your entry. Risk is 10 pips, so the 2R target sits 2 × 10 = 20 pips above your entry.
Size the trade from the stop, not from a feeling. As an illustrative example, take a $5,000 account, 1% risk and a stop 10 pips from entry. Risk in money is $5,000 × 1% = $50. One mini lot (10,000 units) is worth $1 per pip on a USD-quoted pair, so $50 ÷ (10 pips × $1) = 5 mini lots, or 0.50 standard lots.
How often the 9 EMA crosses the 21 EMA
When traders say "9 EMA strategy", they often mean the cross of the 9 EMA over a 21 EMA. The IndicatorFree Lab counted those crosses on past broker demo data. These numbers are past data, not a forecast.
On the EURUSD 1-hour chart, from 2025-10-22 to 2026-10-23, the EMA 9/21 crossed 23.3 times per month (279 crosses). 22% of those crosses were reversed by the next cross within 5 candles. The chart below compares that pace with slower pairs of averages over the same period.
Moving from 1-hour to 4-hour cut crosses from about 23 to 5 a month, but the share that reversed barely changed, and on gold it rose. On the EURUSD 4-hour chart, from 2025-10-23 to 2026-10-23, the EMA 9/21 crossed 5.3 times per month (64 crosses), and 19% were reversed within 5 candles. On the XAUUSD 1-hour chart, from 2025-10-22 to 2026-10-23, it crossed 22.5 times per month (270 crosses), with 24% reversed within 5 candles. On the XAUUSD 4-hour chart, from 2025-10-23 to 2026-10-23, the share was actually higher, at 27% of 64 crosses.
This ties the cross data to the pullback setup with one decision rule: if the 9 EMA and the 21 EMA crossed within the last 5 candles, skip the touch and wait for the next one.
When the 9 EMA helps and when to leave it alone
It helps when price is moving in one direction with shallow pullbacks. It also works as a trailing exit: you stay in while candles close on your side of the line.
Avoid it when the line is flat, when candles close on alternating sides, and just before scheduled news, when one spike can cross the line and return.
| Pros | Cons |
|---|---|
| Reacts within a few candles | Crossed often in a sideways market |
| Gives a clear place for a stop: beyond the pullback low or high | Stops are tight, so the spread takes a larger share |
| Works as a simple trailing exit | Exits early in trends with deep pullbacks |
| Same touch-and-close rule on any market or timeframe | Says nothing about how far price can go |
Practical tips and quick checklist for the 9 EMA
- Take the first or second pullback after a new push. The lab data on this page does not count touches, so test later touches on your own charts before you trade them.
- If price is far from the line, wait. While price stalls or drifts, the line closes one fifth of the gap each candle, so it comes to you. If price keeps running, the gap stays open and there is still no entry.
Quick checklist
- Is the 9 EMA sloping, not flat?
- Did the pullback candle close on the trend side?
- Is the stop beyond the pullback low or high?
- Is the position sized from that stop distance?
FAQ
Does the 9 EMA work in stock trading?
Stocks can gap at the open, so the line may sit far from price after a gap. Give it a few candles to catch up before you read it.
Which timeframe should I put the 9 EMA on?
Use the timeframe you take entries on, and check the direction one timeframe higher first.
Can I trade with the 9 EMA alone?
You can read momentum with it alone, but it cannot tell a trend from a range until after the fact. Most traders add a slower average or a price level, so the 9 EMA only times the entry.
Should I use a 9 EMA or a 9-period simple average?
The simple version weights all nine closes equally, so it turns later. The 9 EMA turns sooner and is crossed more often. Pick one and learn how it behaves on your market.