EMA Pulse
Free EMA Pulse MT5 indicator: trend-colored 9 EMA, ATR stretch bands and pullback arrows. Lab repaint test: 0 of 282 signals changed.
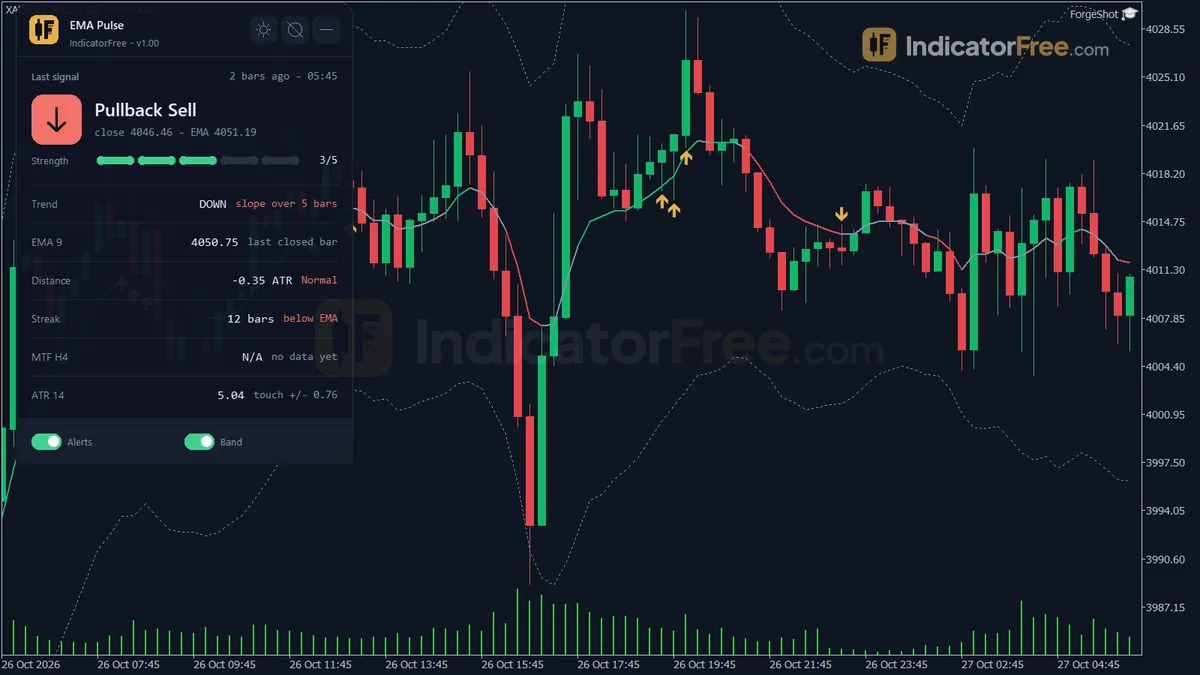
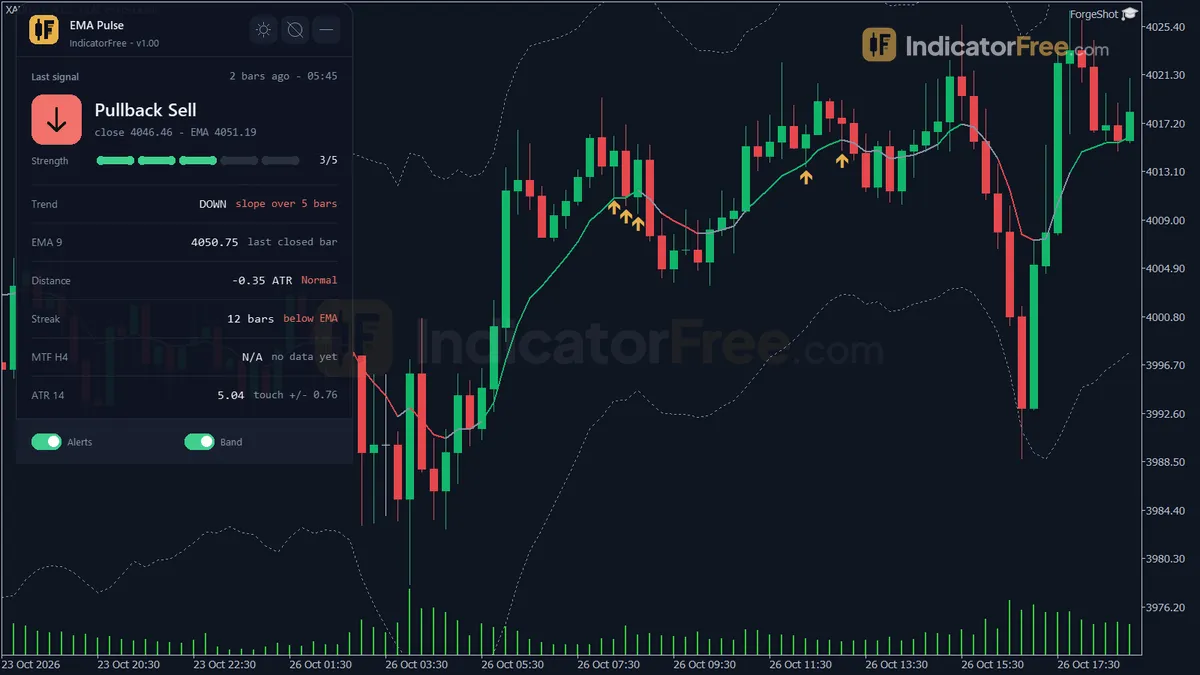
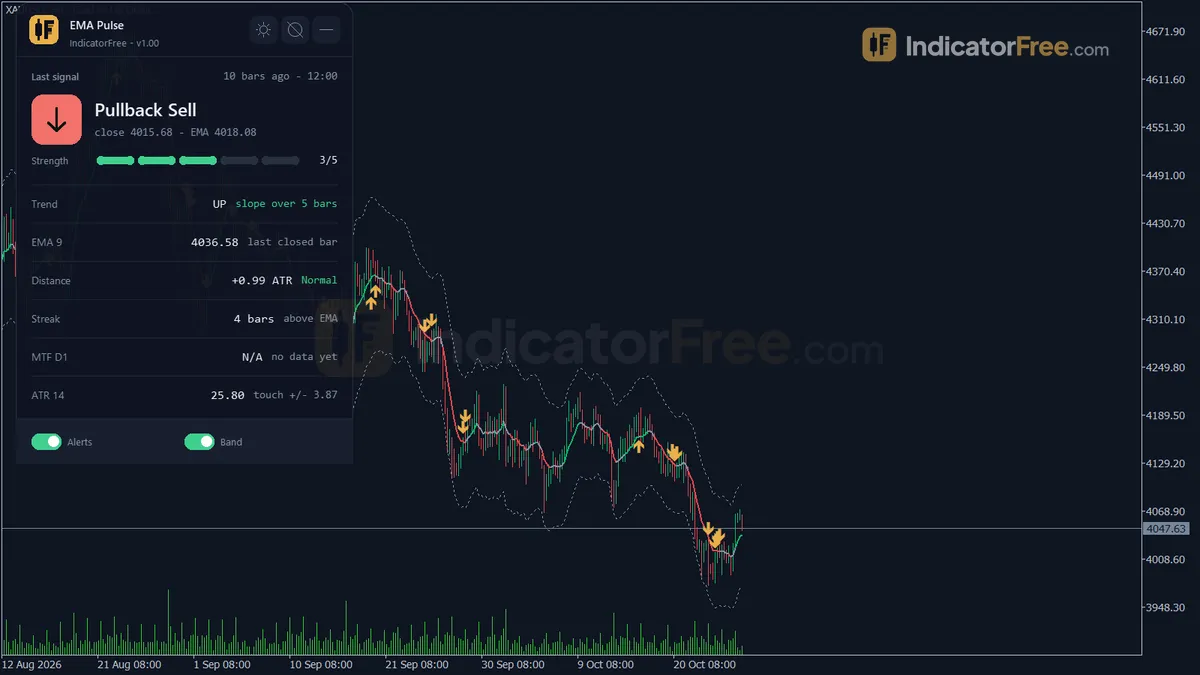
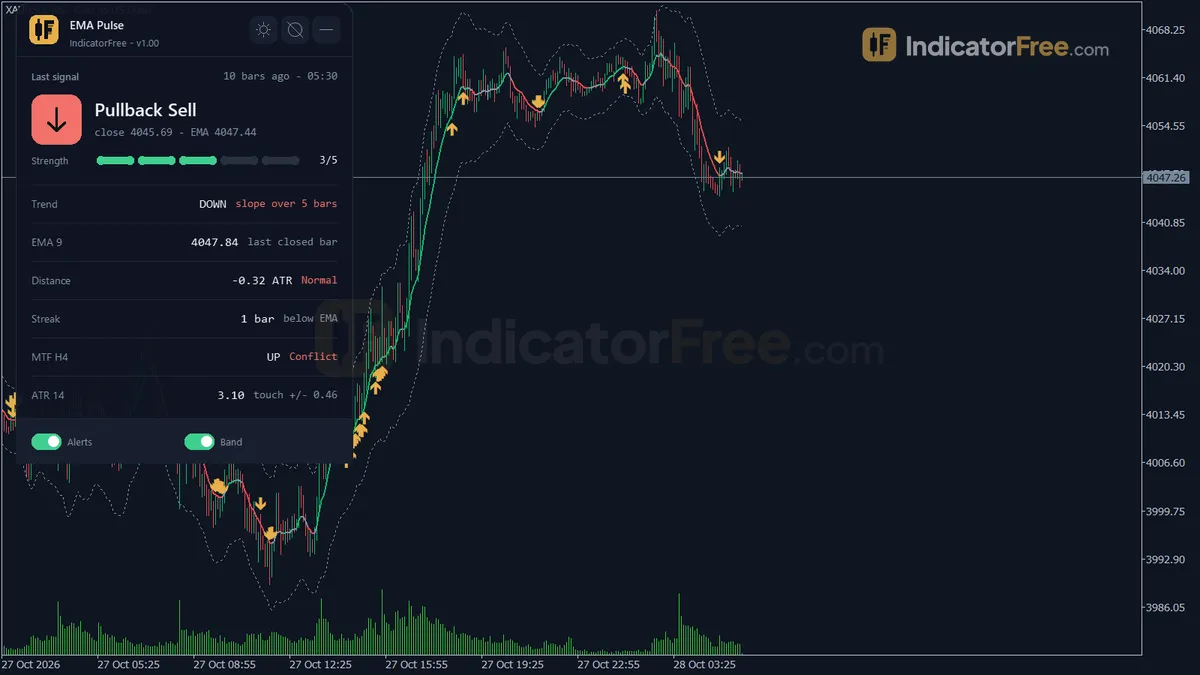
- Repainted
- 0 / 282
- Signals / week
- ≈ 21.5
- Tested on
- EURUSD M15
- Tested
- 2026-10-09
Overview
EMA Pulse is a free MT5 indicator. On your price chart it draws a trend-colored 9-period EMA, two ATR-based stretch bands around that EMA, and Pullback Buy / Pullback Sell arrows when price comes back to the EMA during a trend. In the Lab's repaint test on EURUSD M15, 0 of 282 signals changed. It helps trend traders who would rather wait for a pullback than chase a move that has already run.
What EMA Pulse draws on your chart
An EMA (exponential moving average) is an average of recent prices that gives the newest bars the most weight. ATR (average true range) is the typical size of one bar's move. EMA Pulse measures every distance in ATR, so a "touch" or a "stretch" means the same thing on a quiet pair and on a fast one.
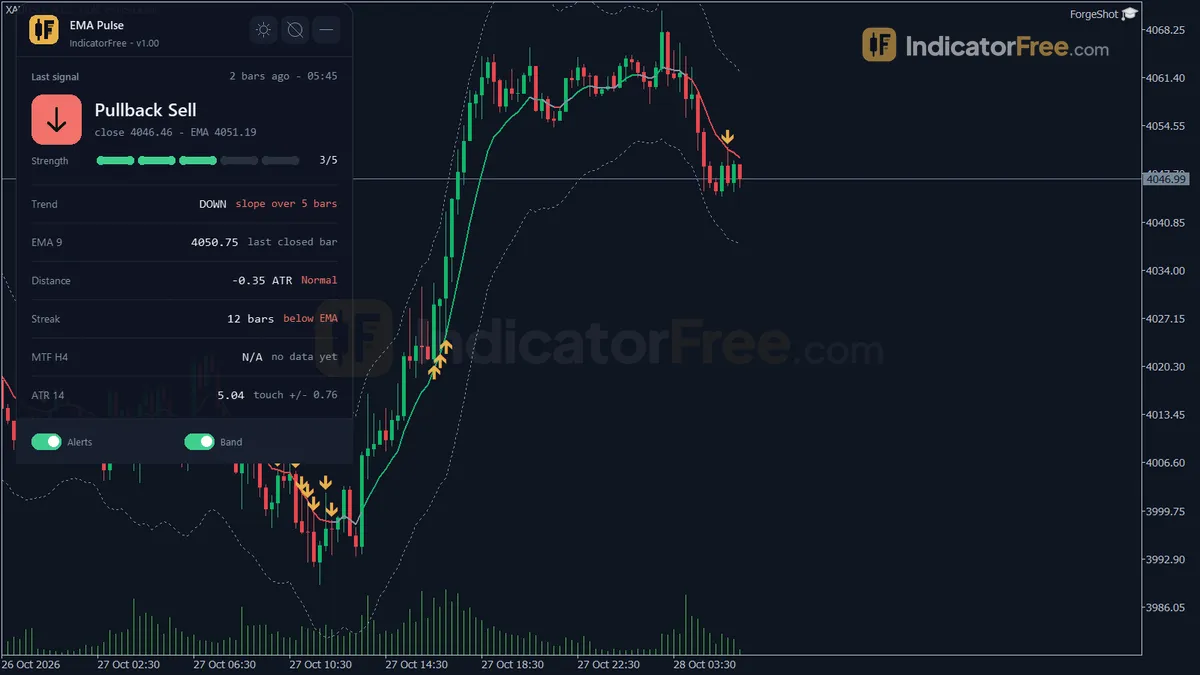
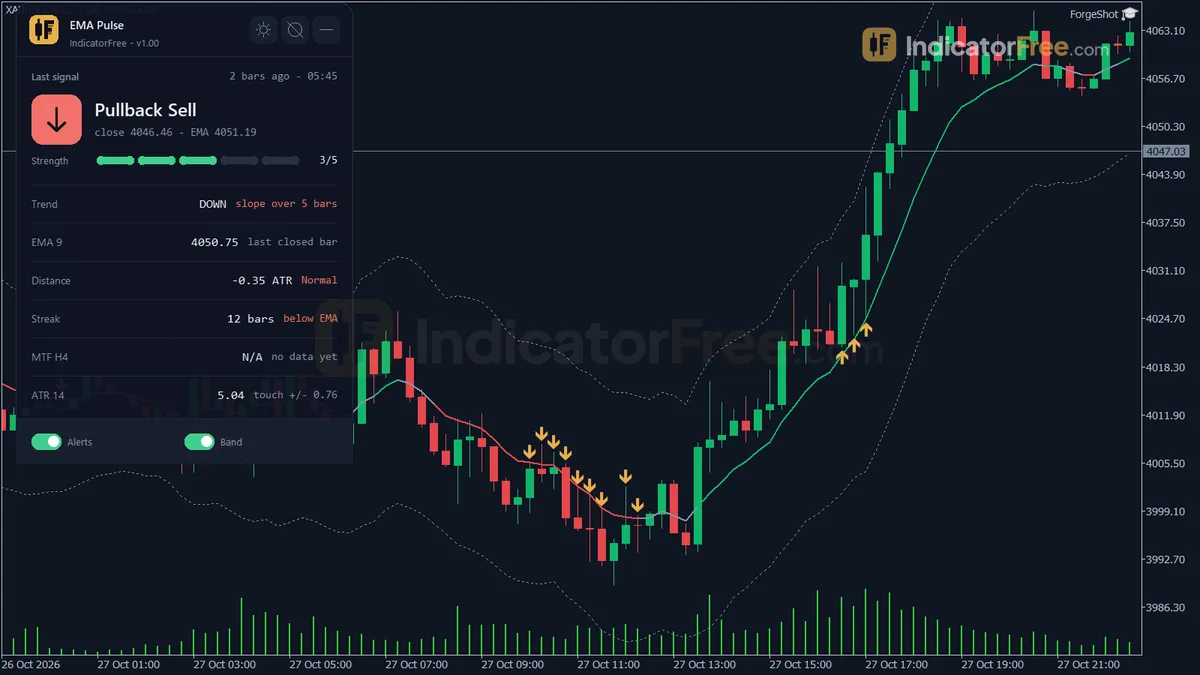
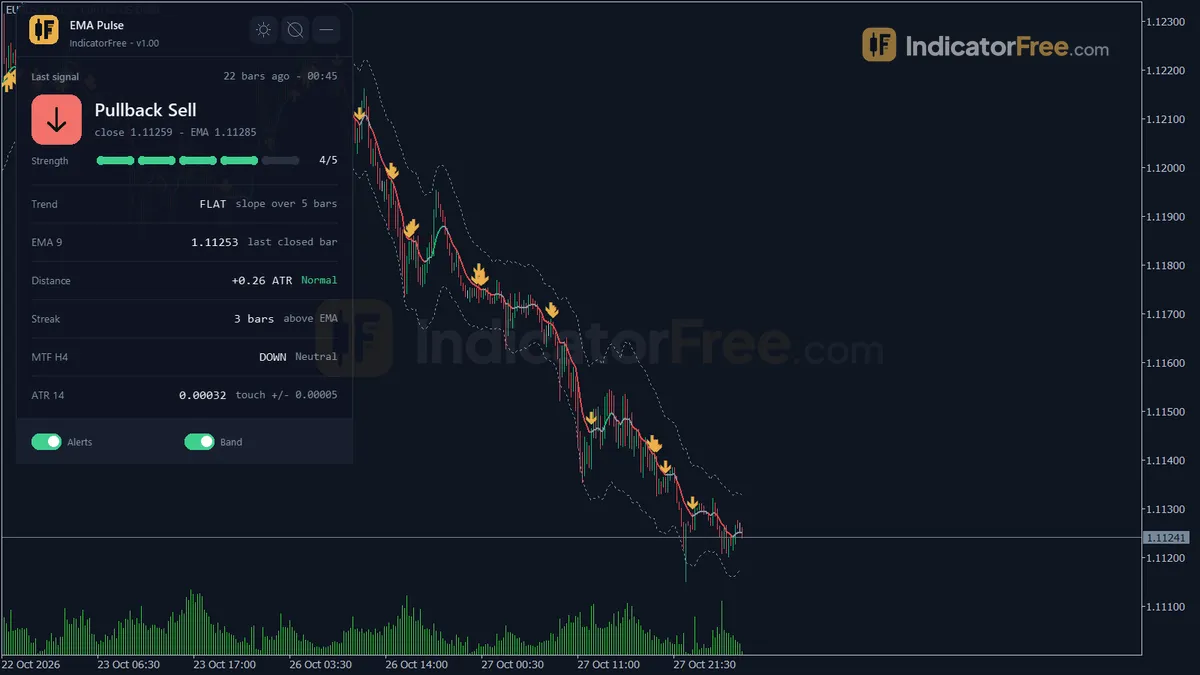
- EMA 9: the main line. It turns green when price keeps closing above it and its slope is rising. It turns red when price keeps closing below it and its slope is falling.
- Upper and Lower Stretch Bands: lines set StretchATRMultiples × ATR (default 2.5) above and below the EMA. When price moves past a band, the panel labels it Stretched.
- Pullback Buy / Pullback Sell arrows: price came back to the EMA during a trend and then closed on the trend side.
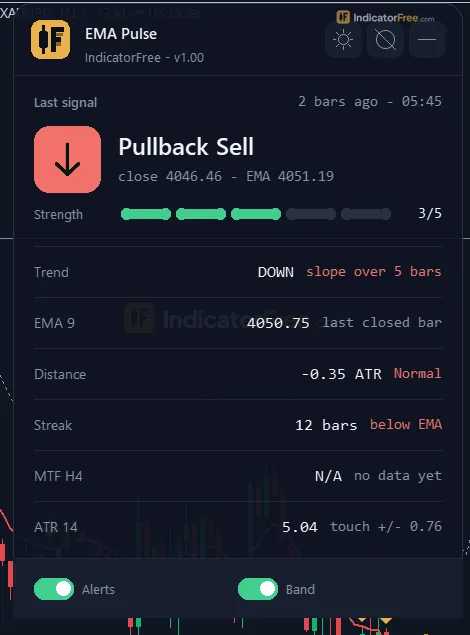
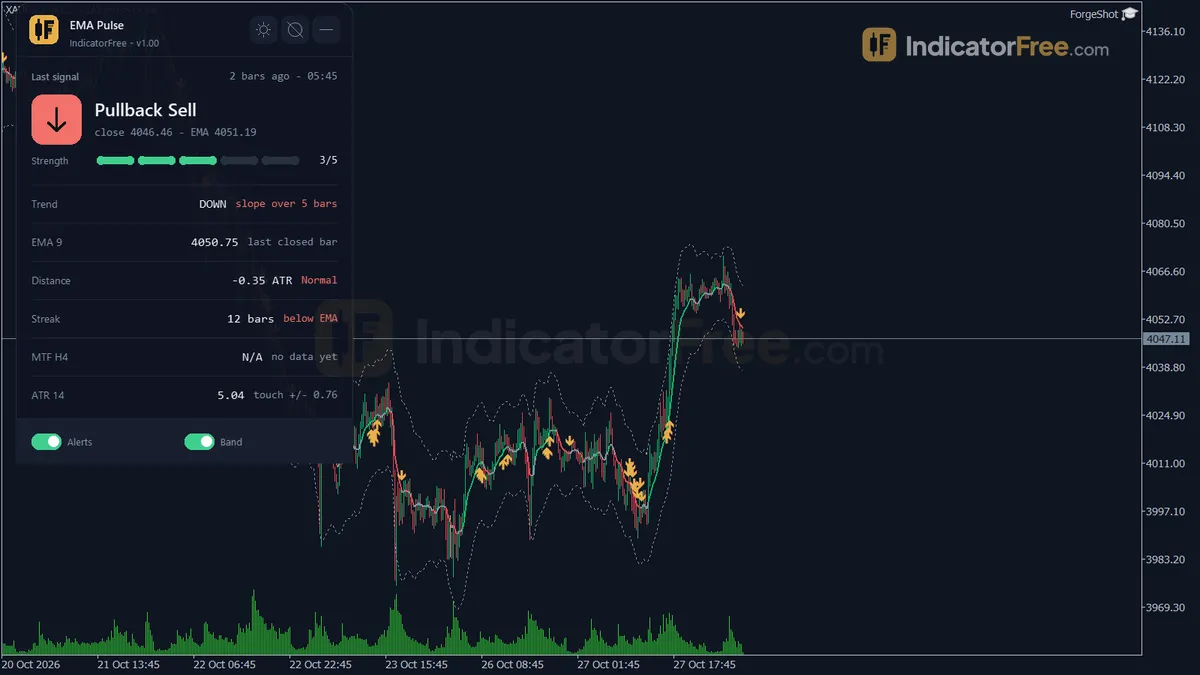
- Status panel: shows the trend, how far price is from the EMA, the close streak, whether the higher timeframe agrees, and the current ATR.
The drawing below shows how these pieces sit together on a rising chart.
How the Lab tested it
The Lab tested version 1.00 on MT5 build 6230. The test ran on EURUSD M15 from 2026-07-09 to 2026-10-08 with real ticks from Raw Trading Ltd, and logged 282 arrows.
Repaint: 0 of 282 signals changed, and the longest arrow delay was 0 bars. The arrows you see on past bars are the same arrows you would have seen live, on the bar where each one fired.
Follow-through: for each arrow, the Lab checked which came first: a 1 ATR move in the arrow's direction or a 1 ATR move against it. The favorable move came first for 40.8% of all 282 signals, which is worse than a coin flip. At that distance the arrows were wrong more often than right, so don't trade them without a filter.
When price did reach 1 ATR in the arrow's direction, it got there quickly, with a median of 2 bars. Only 2.8% of signals reached neither level within 20 bars, so nearly every arrow was settled one way or the other within that window. The test averaged 21.5 signals per week.
The split by direction tells you more than the total:
Sell arrows came close to an even split, while buy arrows fell well behind. The Lab tested one symbol over one three-month window, so read the gap as what happened in that market, not as a fixed trait of the tool.
Who EMA Pulse is for
It suits you if you trade with the trend, mostly intraday, and want a rule-based marker for "price came back to the average and held". The panel also saves you from counting closes and checking a higher timeframe by hand.
How it works
- 1
- 2Up trend: EMA rose over the slope bars by an ATR-based minimum and Close is above it. Down mirrors.
Up if EMA - EMA slope bars ago > 0.05 x ATR x TrendSlopeBars and Close > EMAInputs: TrendSlopeBars - 3Counts how many bars in a row Close has stayed on the same side of the EMA.
- 4Pullback buy: after enough bars in an uptrend, a low comes near the EMA and closes above it.
Buy if Low - EMA <= PullbackTouchATR x ATR and Close > EMAInputs: PullbackMinTrendBars, PullbackTouchATR - 5Draws a stretch band around the EMA and reads the EMA trend of a higher timeframe.
Band = EMA +/- StretchATRMultiples x ATRInputs: StretchATRMultiples, ShowBand, MTFEnable, MTFTimeframe
Specifications
- Platform
- MetaTrader 5
- Version
- 1.00
- Type
- Indicator
- Window
- Main chart
- Draws
- 3 lines, 2 arrows, 1 panel
- Alerts
- popup, push, sound
- Repaints
- No (0 of 282 signals changed)
- Inputs
- 18
- Tested on
- MT5 build 6230 · 2026-10-09
Repaint test
No repaint detected. In a 9 Jul 2026 – 8 Oct 2026 test on EURUSD M15 (Raw Trading Ltd real ticks), 282 signals were logged at bar close and re-read at the end of the test: 0 changed. Arrows print on the bar that closes the signal, with no delay.
IndicatorFree — tested 2026-10-09 · MT5 build 6230 · Raw Trading Ltd real ticks. Results come from historical data, not live trading, and do not guarantee future results.
Signal statistics
Over 9 Jul 2026 – 8 Oct 2026 on EURUSD M15, the indicator printed 282 arrows. After 40.8% of them, price moved 1×ATR(14) in the arrow's direction before moving 1×ATR against it (median 2 bars). 2.8% reached neither level within 20 bars.
This measures price movement after the arrow, not a trading result. It includes no spread, commission, stop loss or position sizing.
What it draws
- A line (EMA 9) from buffer 0.
- A line (Upper Stretch Band) from buffer 2.
- A line (Lower Stretch Band) from buffer 3.
- Arrows (Pullback Buy) from buffer 4, drawn on the closed bar.
- Arrows (Pullback Sell) from buffer 5, drawn on the closed bar.
- An on-chart panel (Status); values shown in the panel are not exposed as buffers.
Inputs
| Input | Default | What it does |
|---|---|---|
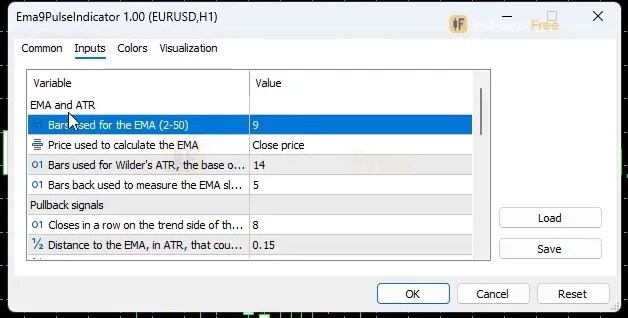
| EmaPeriod | 9 | Bars used for the EMA (2-50) |
| EmaPrice | Close | Price used to calculate the EMA |
| ATRPeriod | 14 | Bars used for Wilder's ATR, the base of the touch tolerance and the stretch (5-50) |
| TrendSlopeBars | 5 | Bars back used to measure the EMA slope that sets the Up / Down / Flat trend (2-20) |
| PullbackMinTrendBars | 8 | Closes in a row on the trend side of the EMA required before a touch counts as a pullback (3-50) |
| PullbackTouchATR | 0.15 | Distance to the EMA, in ATR, that counts as a touch (0.05-1.0) |
| StretchATRMultiples | 2.5 | Distance from the EMA, in ATR, flagged as Stretched; also the band width (1.0-6.0) |
| ShowBand | true | Draw the +/- StretchATRMultiples x ATR band around the EMA |
| MTFEnable | true | Show the higher timeframe EMA trend and alignment on the panel |
| MTFTimeframe | H4 | Higher timeframe to confirm with (bumped to the next larger one if not above the chart) |
| AlertPopup | true | Show a popup alert on a new pullback signal |
| AlertPush | false | Send a push notification to the MT5 mobile app on a new pullback signal |
| AlertSound | false | Play a sound on a new pullback signal |
| SoundFileName | alert.wav | Sound file in the MT5 Sounds folder |
| ShowDashboard | true | Show the status panel |
| PanelScale | 1 | Panel size multiplier (DPI is applied automatically) |
| Theme | Dark | Chart color theme |
| RestoreTheme | true | Restore the original chart colors when the indicator is removed |
How to read it
Install: copy the EMA Pulse .ex5 file (100.3 KB) into the MQL5 Indicators folder (File → Open Data Folder), refresh the Navigator, then drag the indicator onto a chart.
Reading the EMA line color
The color describes the trend. It is not a trade signal. Green means price keeps closing above the EMA and the EMA's slope is rising. Red is the same thing on the downside.
The Up / Down / Flat trend state comes from the EMA's slope over TrendSlopeBars (default 5), compared with a threshold scaled by ATR. If the EMA is almost flat, it doesn't count as a trend, even when price stays on one side of it. A green line doesn't mean buy. It only means Pullback Buy arrows are allowed.
Reading Pullback Buy and Pullback Sell
In this indicator, a pullback means price returns to the EMA after a run of closes on one side, then closes on the trend side again. The steps for a buy are shown below. A sell is the mirror image: the bar's high reaches the EMA from below and the bar closes below it.
- 1Trend streakThe previous closed bar is in an Up trend, with at least PullbackMinTrendBars (default 8) closes above the EMA
- 2TouchThe bar's low comes within PullbackTouchATR × ATR (default 0.15) of the EMA, or dips below it
- 3Close backThe same bar closes above the EMA
- 4Arrow and alertPullback Buy prints on that bar; a popup alert fires by default
The arrow is decided by the bar's close. In the Lab test, Pullback Buy fired 9.1 times a week and Pullback Sell 12.4 times a week.
Reading the Stretch Bands
A band is a distance warning, not a reversal arrow, and EMA Pulse prints nothing when price reaches it. When the panel shows Stretched, price is already far from the EMA. A pullback-style entry means waiting for the next arrow rather than buying the stretched bar.
Reading the Status panel
- Last pullback signal and how many bars ago it fired. Check this before you act, because an arrow from several bars ago is old news.
- Trend state (Up / Down / Flat) and the EMA value.
- Distance to the EMA: how far the close is from the EMA in ATR, labeled At EMA, Normal or Stretched.
- Same-side close streak: compare it with PullbackMinTrendBars to see whether the next touch can count as a pullback.
- Higher-timeframe EMA trend from MTFTimeframe (default H4), labeled Aligned or Conflict. If MTFTimeframe is not higher than your chart's timeframe, the indicator moves it up to the next larger one.
- Current ATR.
Inputs to change first
- PullbackMinTrendBars (default 8, range 3-50): how long the trend must run before a touch counts. Raise it to get fewer arrows that only appear in established trends. Lower it to get earlier arrows, with more noise.
- PullbackTouchATR (default 0.15, range 0.05-1.0): how close price must come to count as a touch. A smaller value accepts only real touches. A larger value also lets in bars that only came near the EMA.
- EmaPeriod (default 9, range 2-50): a longer period gives a slower line that changes trend less often.
- TrendSlopeBars (default 5, range 2-20): a longer slope window makes the trend state slower to change.
- StretchATRMultiples (default 2.5, range 1.0-6.0): moves the bands and the Stretched label. It is not part of the arrow rules.
ATRPeriod (default 14) sets the ATR used for both the touch tolerance and the stretch. Leave it alone unless you have a specific reason to change it. EMA Pulse applies its own chart theme (Theme, default Dark). With RestoreTheme on, your original colors come back when you remove the indicator.
Alerts
All three alert types fire on a new pullback signal. AlertPopup is on by default. AlertPush (off by default) sends a notification to the MT5 mobile app. AlertSound (off by default) plays SoundFileName (default alert.wav) from the MT5 Sounds folder.
A decision rule for each arrow
Pullback Buy: act only if the arrow is on the last closed bar and the panel shows the higher timeframe as Aligned. Skip it if the panel shows Conflict, or if the trend state has already turned Flat.
Pullback Sell: use the same rule in reverse. The arrow must be on the last closed bar, the higher timeframe must be Aligned with a down trend, and you skip it on Conflict or Flat.
The arrows don't check the higher timeframe themselves. They fire whether it agrees or not, and the Lab's numbers include every arrow. This rule is a starting filter, not a Lab result.
The misread to avoid
When a bar dips below a green EMA and also closes below it, that's not a pullback. It may be the start of a break, and EMA Pulse prints no arrow. If you buy every EMA touch while the line is green, you'll take these bars too. Wait for the close, and only act when the arrow is there.
Installation
- 1Download Ema9PulseIndicator.ex5 from the button above (Google Drive).
- 2In MetaTrader 5: File → Open Data Folder → MQL5 → Indicators. Copy Ema9PulseIndicator.ex5 there.
- 3Restart MT5 or right-click Indicators in Navigator → Refresh.
- 4Drag EMA Pulse onto a chart. For push alerts, enable "Allow push notifications" under Tools → Options → Notifications.
- Tested on MT5 build 6230.
Key terms and guides
- 9 EMA
- The 9 EMA is a 9-period exponential moving average: a line that averages recent candle closes and gives the newest ones the most weight. Traders use it to read short-term momentum and to time pullback entries in a trend.
- Moving average
- A moving average is a line drawn from the average closing price of a set number of recent candles, recalculated on every new candle. It smooths out price noise and shows which way the trend is pointing.
- Pullback
- A pullback is a short, temporary move against the main trend: price dips during an uptrend or rallies during a downtrend, then turns back the trend's way. Traders use it to enter a trend at a better price.
- Higher Timeframe
- A higher timeframe is any chart period longer than the one you trade on, such as the daily chart for someone trading the 1-hour chart. Traders use it to see the bigger trend and the main price levels around their smaller-chart trades.
- Trend
- A trend is the main direction price keeps moving in over a period. In an uptrend price makes higher highs and higher lows. In a downtrend it makes lower highs and lower lows.
- Symbol
- A symbol is the short code a trading platform uses to name one tradable market, such as EURUSD for the euro against the US dollar or XAUUSD for gold. Every quote, chart and order is tied to exactly one symbol.
More on this subject: Trend & moving averages guide, terms and tools
User reviews
No reviews yet. Members who download the tool can review it here.
Sign in and download the tool to review it.
Build a checklist with it
EMA Pulse does one job on the chart: trend / context. Put it on the same chart as the tools below and the IndicatorFree panels merge into one checklist card, ordered trend, zone, signal, risk.
- Zone / levelDynamic Support LineAdds where price is: the zones and levels that EMA Pulse does not draw.
- Entry signalCCIAdds the entry signal: the moment to act once EMA Pulse has set the scene.
The Lab has not tested these combinations. Each tool is tested on its own; the card only lines up what each one says. Free members get 2 new tools a day. If one has to wait until tomorrow, install BlackBox to raise the limit to 5 a day (20 on a live account).
FAQ
Does EMA Pulse repaint?
No repaint detected. In a 9 Jul 2026 – 8 Oct 2026 test on EURUSD M15 (Raw Trading Ltd real ticks), 282 signals were logged at bar close and re-read at the end of the test: 0 changed. Arrows print on the bar that closes the signal, with no delay.
Can I use EMA Pulse in an EA?
Yes. Read buffer 4 (Pullback Buy) with iCustom() on bar 1 — the last closed bar.
Why can’t my EA read the zones?
Zones and the panel are chart objects, not indicator buffers, so iCustom() does not return them.
How do I get alerts on my phone?
Enter your MetaQuotes ID under Tools → Options → Notifications, tick "Enable push notifications", and keep the push alert input on.
Does it work on other pairs?
Tested on EURUSD only; other symbols not tested.
Which timeframe does EMA Pulse work best on?
The Lab measured EURUSD M15 only, so that is the only timeframe with test numbers behind it. The rules are calculated the same way on every timeframe, but results on other timeframes are untested. Check the arrows on your own chart history first.
Can I use EMA Pulse on XAUUSD or index futures?
Yes. It runs on any MT5 chart, and its touch and stretch distances adjust to each symbol's ATR. The Lab has not tested it on gold or indices, so don't assume the EURUSD numbers apply there.
How do I get EMA Pulse alerts on my phone?
Set AlertPush to true. Each new pullback signal is then sent to the MT5 mobile app. The indicator sends the alert from your terminal, so the terminal must stay running with the chart open.
Why is there no arrow when price clearly touched the EMA?
A touch only counts after enough closes in a row on the trend side (PullbackMinTrendBars, default 8), and only when the previous bar was in an Up or Down trend. Check the close streak and trend state on the panel. A short streak or a Flat trend accounts for most missing arrows.
Why did my chart colors change after adding EMA Pulse?
EMA Pulse applies its own chart theme, set by the Theme input (default Dark). With RestoreTheme on (the default), your original colors come back when you remove the indicator.
Changelog
- 1.00Initial release: trend-colored 9-period EMA (hand-calculated, SMA-seeded) with Up/Down/Flat coloring based on EMA slope versus an ATR-scaled threshold. · 2026-10-09
Final verdict
Verdict: a clear pullback marker, not a stand-alone signal
EMA Pulse does one job with fixed, visible rules: it marks trend pullbacks to the EMA, with every distance scaled by ATR. Its arrows stayed put in the repaint test, so the history you study matches what you would have seen live. The panel puts the close streak, the stretch and the higher-timeframe check in one place.
Its weak point is follow-through. On their own, the arrows reached 1 ATR against more often than 1 ATR in their favor, and buys were the weaker side in the test. Use EMA Pulse as an entry trigger inside a plan you already have. It can't be the plan by itself.
Limits to know before you download
- It gives no stop loss, no target and no exit. You decide all three.
- In sideways markets the trend state turns Flat and the close streaks keep resetting, so arrows become rare. Be extra skeptical of any arrow near an EMA that is flattening out.
Skip it if
- you trade ranges or fade extremes, because the bands are not a fade signal;
- you want a tool that tells you when to get out;
- you plan to take every arrow without a filter.
Settings to start with
- Start with the default inputs on EURUSD M15 with MTFTimeframe H4. That is the Lab's test symbol and timeframe.
- Be stricter with Pullback Buy. For example, raise PullbackMinTrendBars to 12. This starting point was not tested by the Lab, so compare it with the default 8 on your own chart history.
- If you get arrows from bars that only came near the EMA, try PullbackTouchATR 0.10. This value is also untested; compare it with the default.
- On H1 charts, try MTFTimeframe D1 as the higher-timeframe check. Also untested.
- Turn on AlertPush if you won't be watching the screen.
To give the arrows a slower trend backdrop, you could take Pullback Buy only while Golden Cross shows the 50/200 regime as bullish, and Pullback Sell only while it is bearish. This is an idea to try, not a Lab result: the Lab has not tested the pair.