









Trend indicators
- Indicators
- 9
- Expert Advisors
- 0
- Downloads
- 13
9 tools
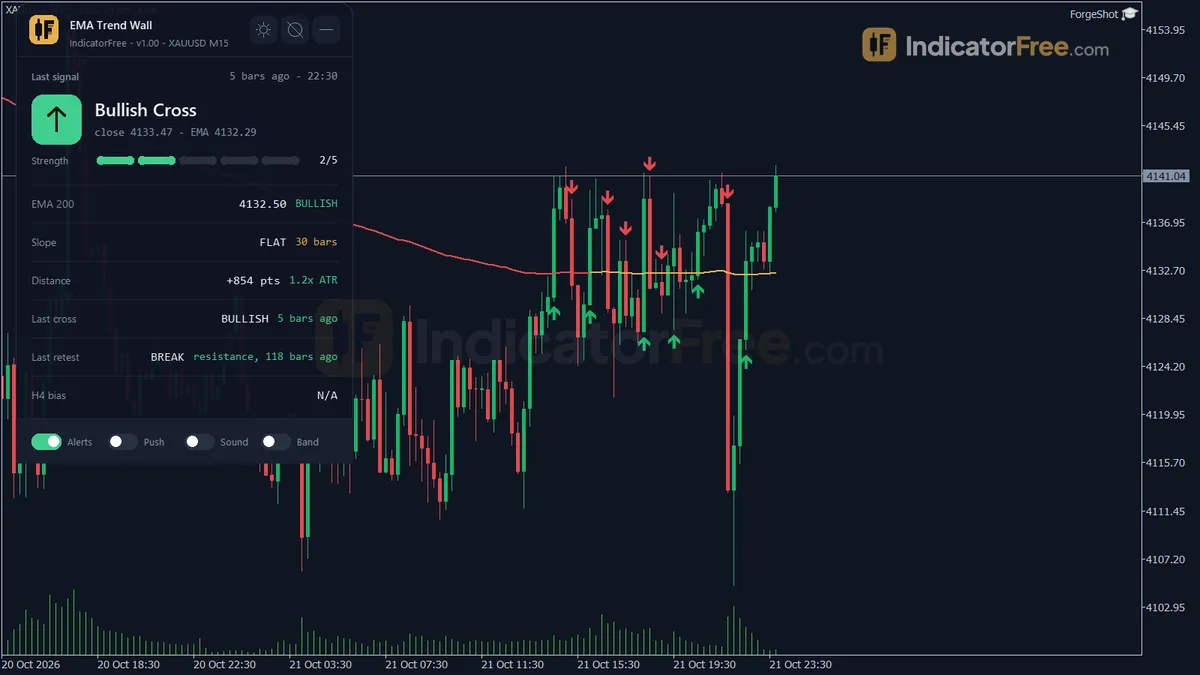
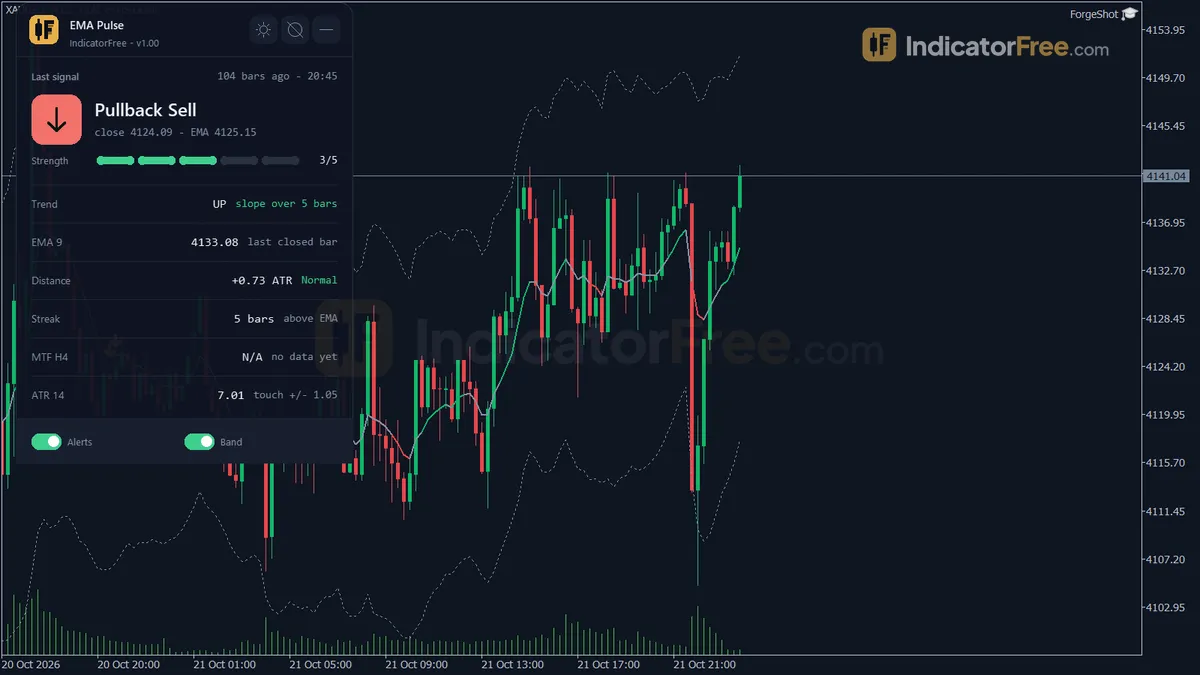
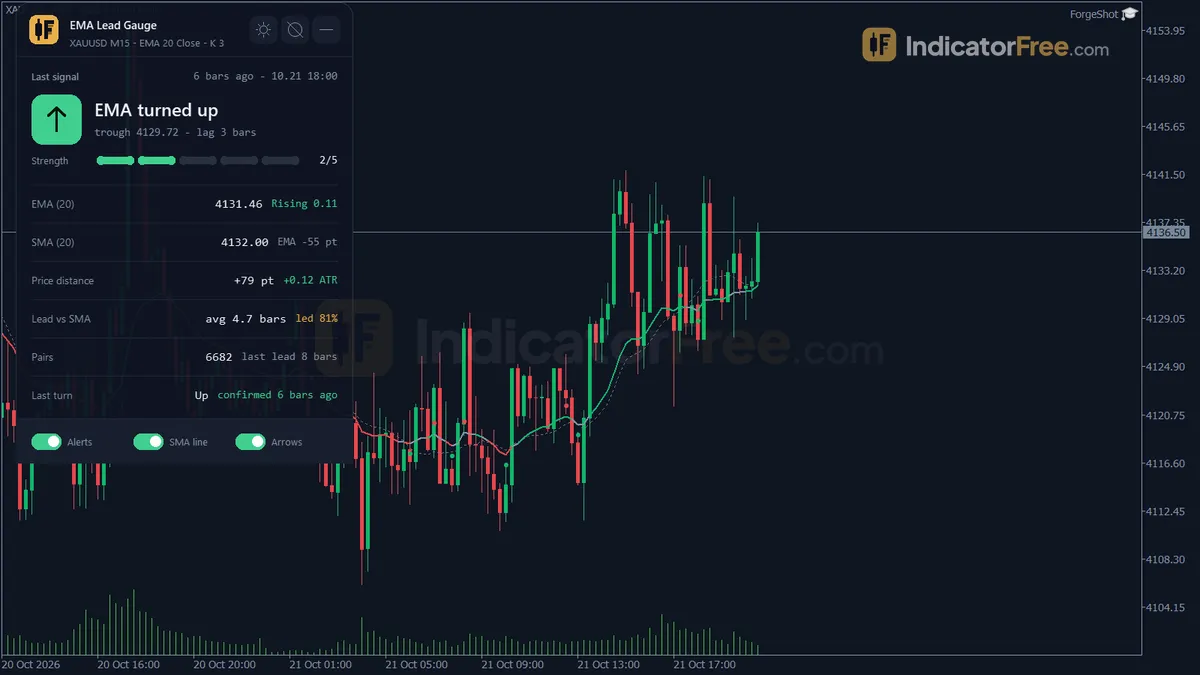
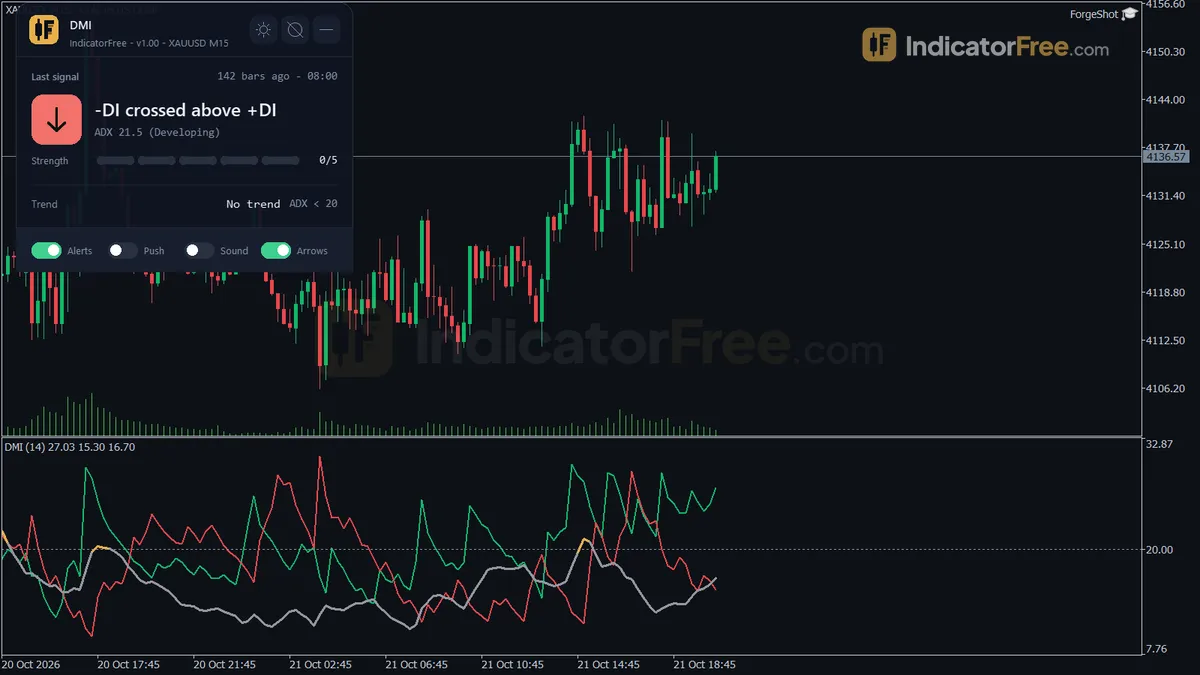
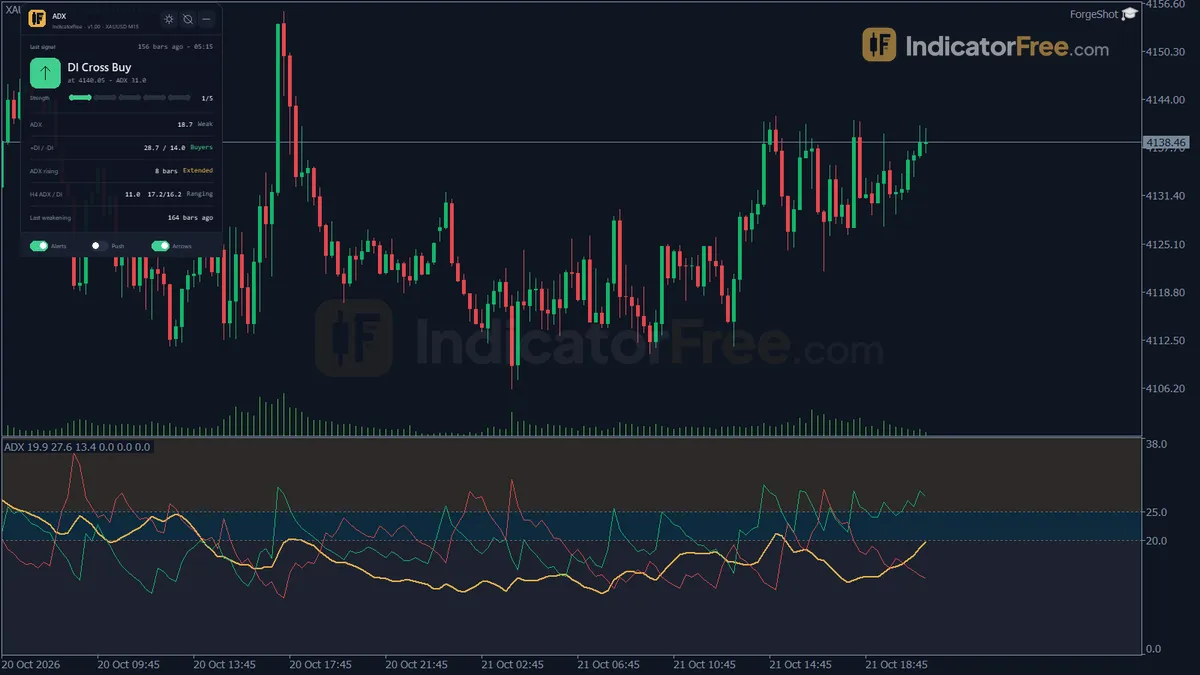
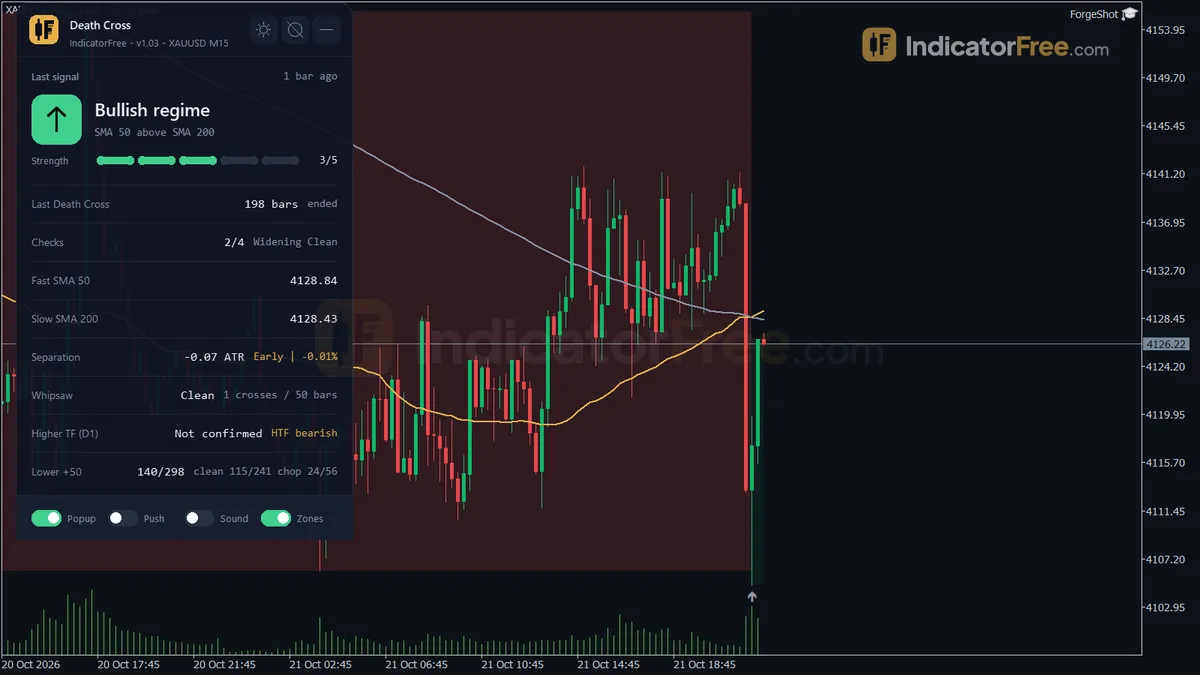
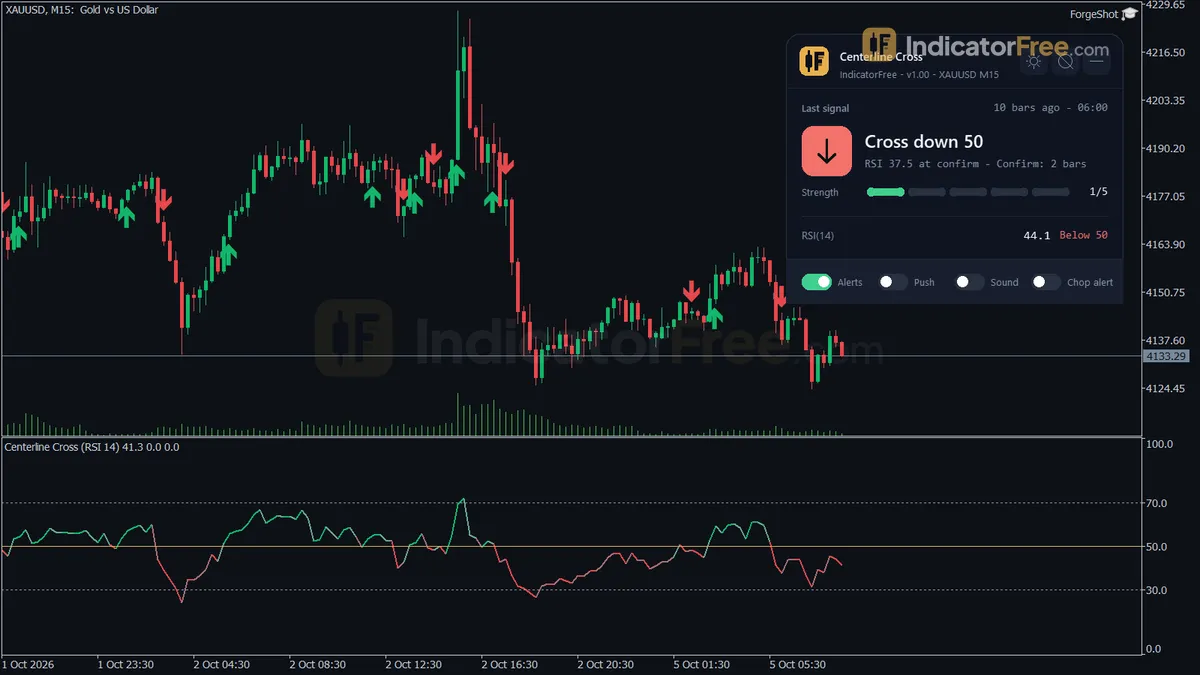
Trend indicators answer one question: which way is the market going, and is that direction worth following? They smooth out the noise of single candles and draw a line, a band or a reading you can check in a second. Their main job is not to find entries. It is to stop you buying in a downtrend, selling in an uptrend, or trading at all when there is no trend.
Moving averages, Supertrend, ADX and Ichimoku compared
Trend tools fall into a few families. They overlap, but each has a distinct strength.
| Type | What it shows | Main weakness |
|---|---|---|
| Moving averages (SMA, EMA, Hull) | Average price over a period; slope gives direction | Lags; whipsaws in ranges |
| Supertrend / SAR | A trailing line that flips sides when the trend changes | Flips often in quiet markets |
| ADX / DMI | Trend strength, and which side (buyers or sellers) is in control | Says nothing about entry price |
| Ichimoku | Direction, momentum and support in one system | Many lines; takes time to learn |
| MA crosses | Change of trend when a fast average crosses a slow one | Signals come late |
A moving average is the base of most of these. Faster versions such as the Hull moving average cut lag but react to more noise. The Supertrend uses volatility, through an ATR multiplier, to decide how far the line sits from price.
Use ADX levels to separate a trend from a range
Before any indicator, look at the swings. An uptrend makes a higher high and a higher low. A downtrend does the opposite. When swings overlap with no clear progress, you are in a sideways market.
Then use a tool to confirm. A simple if/then rule many traders use:
- If ADX is above 25 and rising, treat the market as trending. Follow the trend tool.
- If ADX is below 20, treat it as a range. Ignore trend crossovers and flips.
- Between 20 and 25, wait. The market has not decided yet.
The ADX does not tell you direction on its own. Pair it with the DMI lines or with the slope of an average.
Treat a moving-average cross as a filter, not a trigger
The most common mistake with trend tools is treating every cross as a trade. A golden cross, where the 50-period average crosses above the 200, sounds strong. But by the time it happens, much of the move is often over. In a range, the two averages can cross back and forth several times in a week.
Use crossovers as a filter, not a trigger. Once the fast average is above the slow one, you only look for long setups. Your actual entry comes from a pullback to a level or a candle pattern. This one change removes many poor trades.
A gold pullback trade filtered by a 50 EMA and ADX
Example: you trade XAUUSD on the H1 chart with a 50 EMA and ADX(14).
- Price is at 2,400 and has stayed above the 50 EMA for two days. The EMA slopes up.
- ADX reads 28 and rising. The trend is active.
- Price pulls back to 2,385, touching the EMA, and prints a bullish candle.
- You enter long at 2,387 with a stop at 2,377, 10 dollars below. Your first target is the recent high at 2,405.
Now the other side. If ADX had read 16, with price crossing the EMA every few hours, you would skip the setup entirely. The tool did its job by telling you not to trade.
Products in this group include tools such as the EMA Trend Wall and the ADX indicator.
Trend tool periods for scalping, day and swing trading
Match the tool to how long you hold trades.
- Scalping on M1 to M5: short EMAs (9 to 21) or a tight Supertrend. Expect many flips. Use a higher timeframe average as your main bias.
- Day trading on M15 to H1: a 50 EMA plus ADX works as a clean trend filter.
- Swing trading on H4 to D1: 50 and 200 averages, Ichimoku, or a wider Supertrend.
Keep one rule: the higher timeframe sets direction, the lower one sets timing. If the H4 trend is down, a buy signal on M15 is a counter-trend trade, and you should treat it with caution.
In MetaTrader 5, change one input at a time, such as the period or the multiplier. Then replay the chart in the Strategy Tester to see how often the line flips in quiet hours. Trend tools are rarely the cause of losses on their own. Using them in the wrong market is.
Log every low-ADX moment for one week
Read the trend topic hub to see how trend lines and channels fit with these tools. Then put a 50 EMA and ADX on a demo chart and, for one week, write down each time ADX was below 20. Check whether a trend trade at those moments would have worked. That record will teach you more than any setting.