









Price action & SMC
- Indicators
- 11
- Expert Advisors
- 0
- Downloads
- 45
11 tools
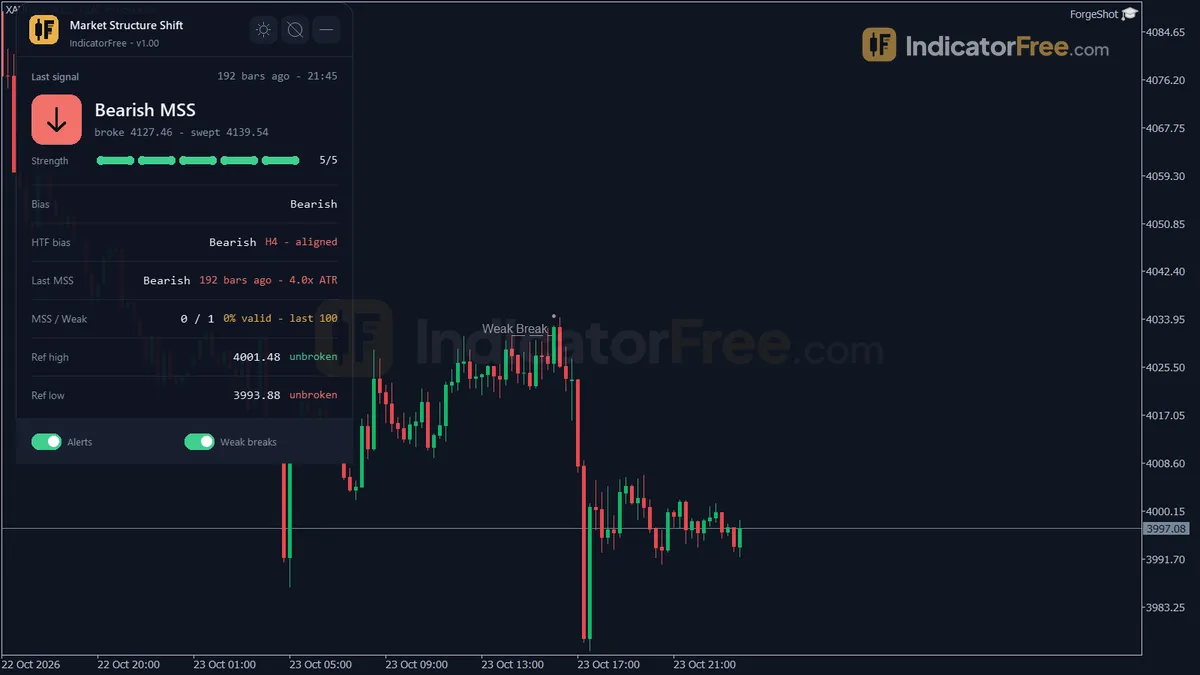
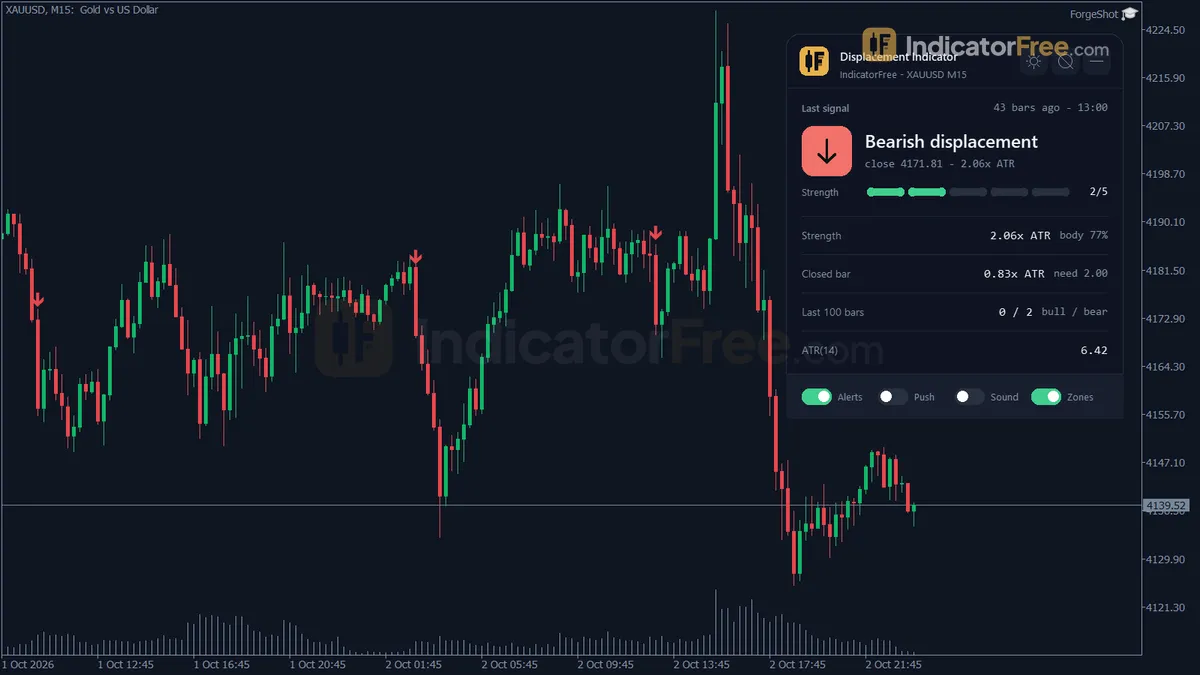
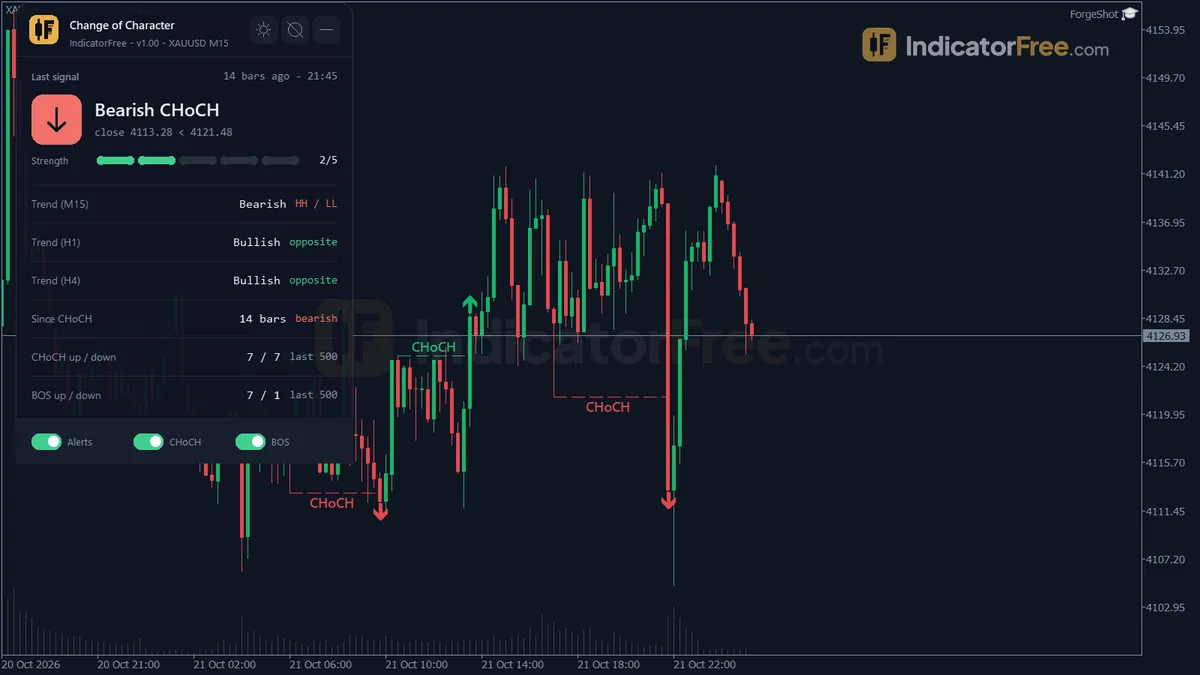
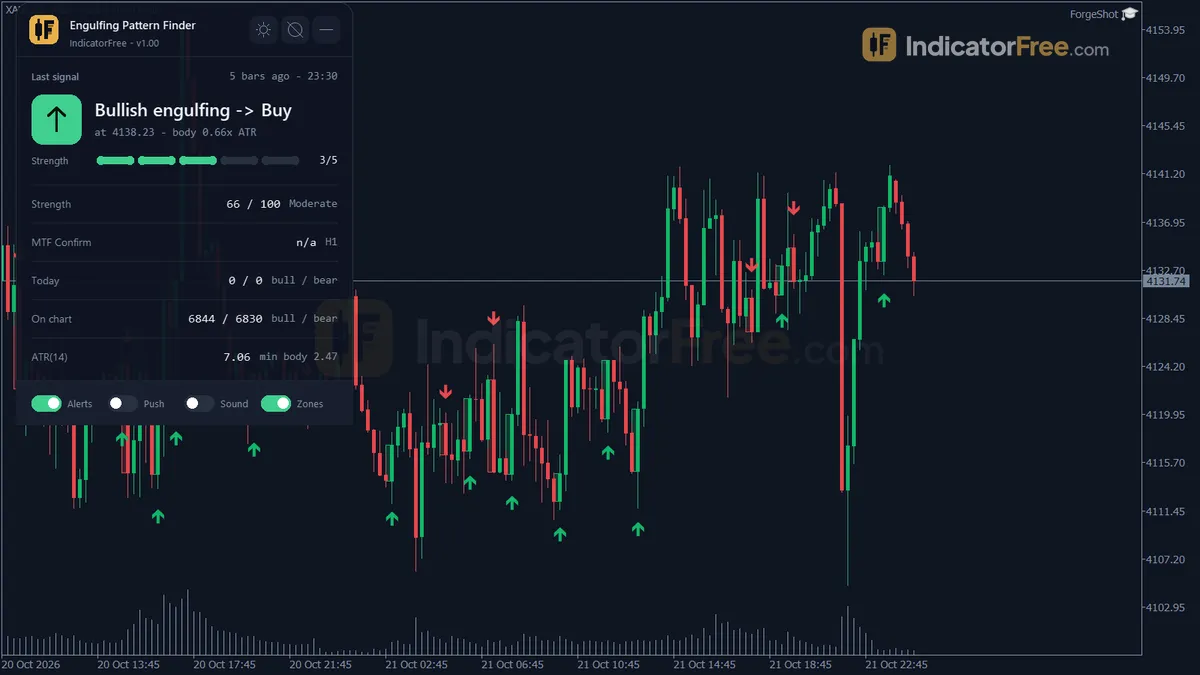
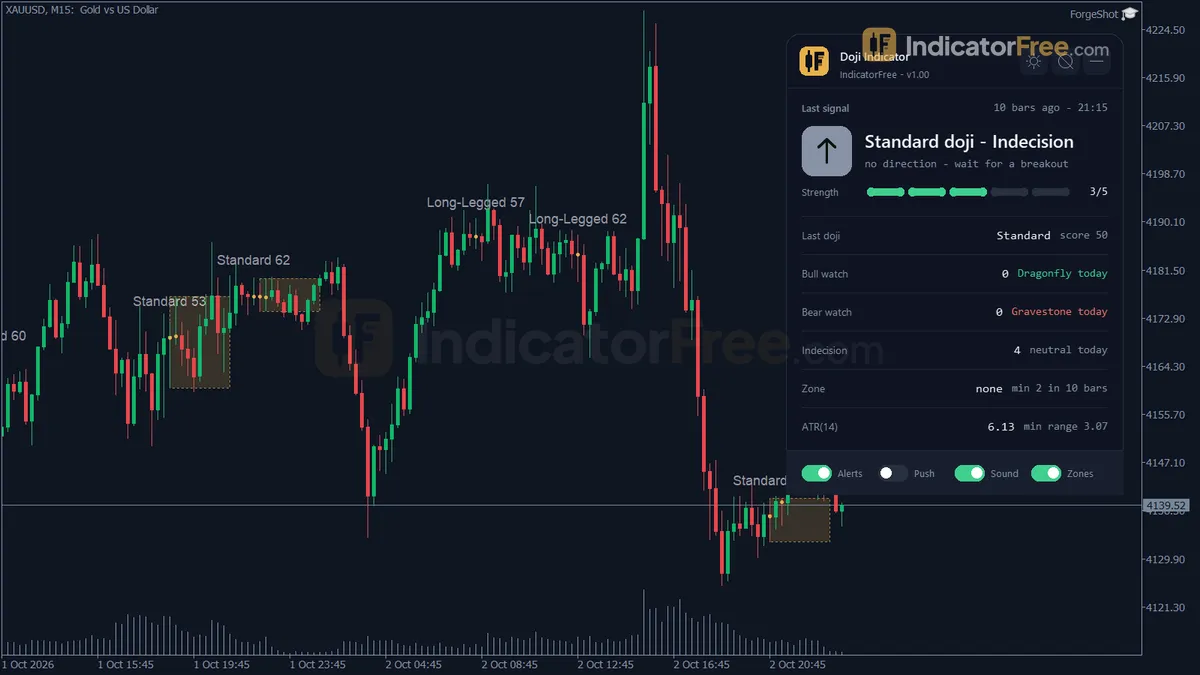
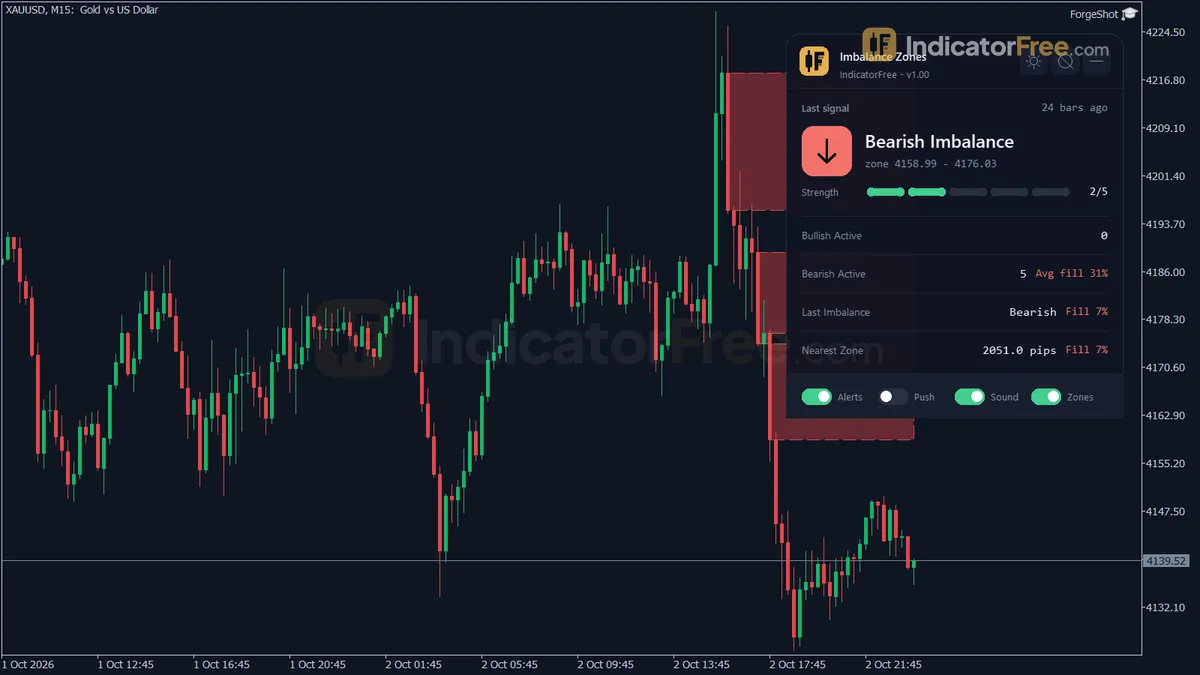
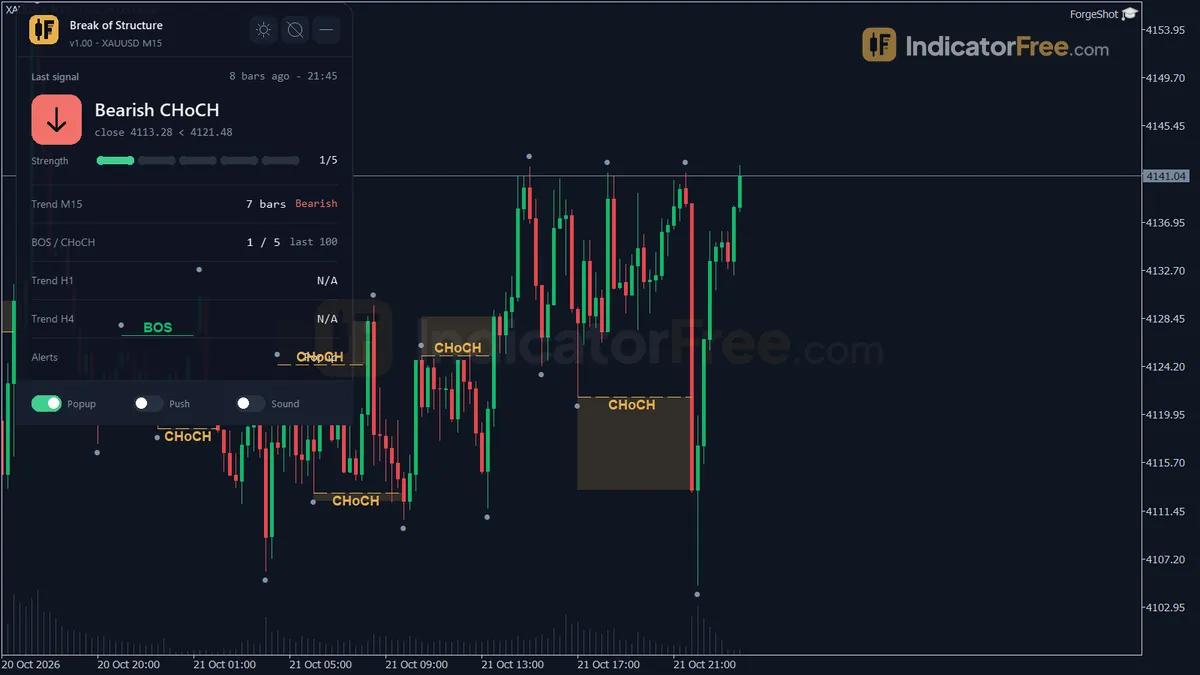
Price action tools read the chart the way a discretionary trader does, but faster and more consistently. They mark swing highs and lows, structure breaks, order blocks, imbalances, liquidity sweeps and single-candle patterns. The problem they solve is not a lack of signals. It is the opposite: two traders look at the same chart and mark different things. A tool applies one fixed rule every time.
Order blocks, imbalances, sweeps and structure at a glance
This group mixes classic price action with what many traders call smart money concepts (SMC). The names differ, but all describe how price moves between areas.
| Concept | What the tool marks | What it tells you |
|---|---|---|
| Market structure | Swing highs and lows, break of structure, change of character | Whether the trend is intact or shifting |
| Order blocks | The last opposite candle before a strong move | A zone where price may react on return |
| Imbalance / fair value gap | A gap between the wick of the first candle and the wick of the third in a fast three-candle move | An area price often revisits |
| Liquidity | Equal highs, equal lows, obvious swing points | Where stop orders likely sit |
| Candle patterns | Pin bars, engulfing patterns, doji, inside bars | Rejection, indecision or a shift in control |
Every one of these is built from the candlestick itself: open, high, low, close. No averages, no smoothing. That is why price action tools lag less than most indicators, but it is also why they produce more marks you must filter.
Structure first, patterns second
The order you read things matters. A pin bar in the middle of nowhere means little. The same pin bar at the edge of an order block, after a sweep of equal lows, in an uptrend, means a lot more.
Use this checklist from the top down:
- Structure: is the last break up or down?
- Location: is price at a zone that fits that direction (order block, imbalance, key level)?
- Liquidity: has price just taken out an obvious high or low?
- Trigger: is there a candle that shows rejection at that spot?
If you only have item 4, you have a pattern, not a setup. Wait.
Why a liquidity sweep is not always a reversal
Liquidity sweeps are popular, and easy to misread. Price spikes above equal highs, stops trigger, then price drops back. It looks like a reversal. Sometimes it is. But in a strong trend, price often sweeps a high, pauses, then keeps going.
The fix is to ask what happened next. If the sweep is followed by a break of structure the other way, with a clear impulsive move, the reversal case is stronger. If price just drifts back inside the range, it may be noise. Treat the sweep as a warning, and let structure make the decision.
Another limit: swing and fractal markers need future bars to confirm a high or low. On live charts they can appear late or move. Check how a tool behaves with our repaint test notes before you rely on it.
A GBPUSD order block entry after a sweep of lows
Example: GBPUSD on M15, with the H1 trend up.
- The structure tool shows a bullish break of structure at 1.2700.
- The move up left an order block at 1.2680 to 1.2690 and an imbalance just above it.
- Price returns, sweeps a small low at 1.2678, and closes back inside the zone.
- A bullish engulfing candle forms at 1.2686.
You enter at 1.2688 with a stop below the sweep at 1.2672, 16 pips of risk. Target: the recent high at 1.2730, 42 pips away. If price trades down to 1.2672 instead, the stop is hit, the zone has failed and the idea is cancelled. You do not move the stop to hope it comes back.
Tools in this group include the Market Structure Shift indicator and the Order Block Locator.
Add SMC tools one at a time, starting with structure
Many traders load every SMC tool at once and end up with a chart covered in boxes.
- If you are new, start with a structure tool only. Learn to see breaks and shifts before anything else.
- If you already read structure, add one zone tool: order blocks or imbalances, not both at first.
- If you trade reversals, a sweep or equal-highs tool is useful for timing.
- If you prefer simple rules, candle pattern finders give clear triggers, but always combine them with a level.
Price action tools combine well with tools from other groups. A level tool from the support and resistance group can confirm that an order block sits near a prior daily high. A trend tool on a higher timeframe can tell you which side of structure to favour. Keep the roles clear: price action finds the place, the trend tool picks the side.
Mark structure breaks by hand, then compare with the tool
Read the price action topic hub to build a shared vocabulary for these concepts. Then add a structure tool to a demo chart and mark, by hand, every break you see for three days. Compare your marks with the tool. Where you disagree is where you will learn the most.