









Engulfing pattern
Also called Engulfing candle, Bullish engulfing, Bearish engulfing, Engulfing candlestick pattern
An engulfing pattern is a two-candle reversal signal. The second candle's body is the opposite color and fully covers the body of the candle before it, which shows that the other side has taken control of price.
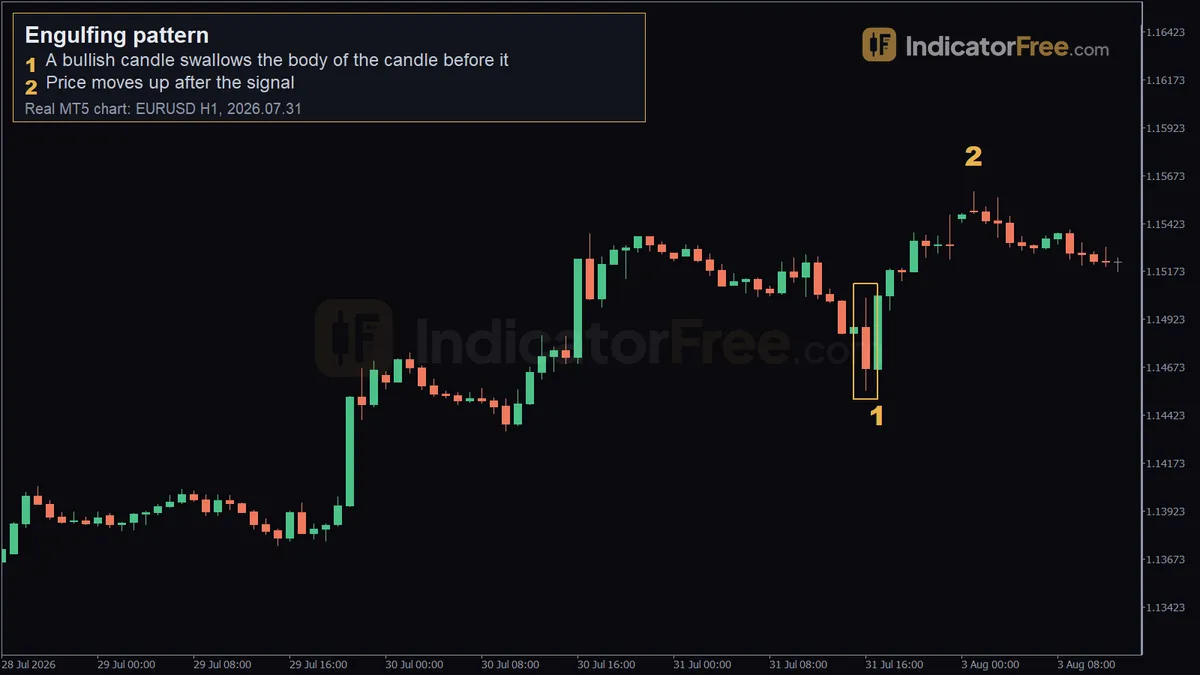
Once you learn the shape, you will see engulfing candles all over your charts, and most of them lead nowhere. Whether you make or lose money depends on the filter: where the pattern forms, how the second candle closes, and where you put your stop.
How to identify an engulfing pattern: 6-point checklist
- A clear move comes first. A bullish engulfing needs falling price before it. A bearish one needs rising price. If there is no prior move, there is nothing to reverse.
- The two candles have opposite colors. Bearish then bullish for a bullish engulfing. Bullish then bearish for a bearish one.
- The second body covers the first body. Compare the open-to-close bodies, not the wicks. The second body must reach past both ends of the first body.
- The second candle closes near its extreme. A bullish engulfing should close in the upper part of its range, and a bearish one near its low. A long wick against the move means the push was sold back.
- The second candle is finished. Judge it only after the candle close, the last price of that period. A candle that looks engulfing 40 minutes into the hour can shrink before the hour ends.
- It sits at a level that matters. A prior swing high or low, a support or resistance zone, or an order block gives the pattern a reason to work.
What makes an engulfing pattern weak or broken
The drawing below shows a body that really swallows the one before it, next to two shapes that only look similar.
A pattern is weak when the first candle is tiny, because covering a small body says very little. It is also weak in the middle of a range far from any level, or when the second candle closes with a long wick pointing back against it.
A pattern is broken when price later closes beyond the far end of the engulfing candle: below its low for a bullish one, above its high for a bearish one. The side that drove the candle has been overrun, and the trade idea is over.
A common mistake in forex: older textbooks say the second candle must open beyond the first candle's close, with a gap. Forex trades around the clock, so the next candle usually opens at the previous close and that rule is almost never met. Drop the gap rule. Judge only how much of the first body is covered and where the second candle closes.
Reading the EURUSD 1-hour engulfing example
The chart at the top of the page is a past example from the EURUSD 1-hour chart, not a prediction.
Marker 1 (2026.07.31 17:00, 1.14625). This is the low of the pattern candle. It opened at 1.14665, dipped to 1.14625, rallied to 1.15064 and closed at 1.15046. Its bullish body swallows the body of the candle before it.
You can check its quality yourself:
- Body: 1.15046 − 1.14665 = 0.00381, or 38.1 pips.
- Full range: 1.15064 − 1.14625 = 0.00439, or 43.9 pips.
- Upper wick: 1.15064 − 1.15046 = 1.8 pips. It closed within 2 pips of its high, so buyers held the move into the close.
Marker 2 (2026.08.03 01:00, 1.15589). Price kept rising after the signal and moved 54 pips up in the next 10 candles. From the 1.15046 close to 1.15589 is 54.3 pips.
Look at the dates. The pattern formed on a Friday afternoon and marker 2 falls on Monday. Anyone holding the trade carried it through the weekend, when the market is closed and Monday can open far from Friday's close. That risk has nothing to do with the pattern itself.
Engulfing pattern trading strategies with entry, stop and target
The plans below are one illustrative example. The EURUSD prices in setups 1 and 2 are real past prices, but the account size, stop buffer and targets are choices made to show the method. Setup 3 uses made-up prices.
Setup 1: Buy the close of the bullish engulfing candle
- Entry: buy at the close, 1.15046.
- Stop loss: 45 pips below the entry. The pattern low of 1.14625 is 1.15046 − 1.14625 = 42.1 pips below the entry, so a 45-pip stop sits just under it.
- Target: 1:1, which is 45 pips above the entry. Price reached 1.15589 by marker 2, 54.3 pips above the entry, so it passed this target on the way. A 2:1 target, 90 pips above the entry, is beyond the highest price the example's facts show.
Your stop sets the position size, not your confidence in the trade:
Setup 2: Wait for a pullback to the middle of the engulfing body
- Entry: a buy limit at the body's midpoint, halfway between the 1.14665 open and the 1.15046 close. That is 38.1 ÷ 2 = 19.05 pips below the close.
- Stop loss: the same stop as setup 1, 45 pips below the close. Risk = 45 − 19.05 = 25.95, or about 26 pips.
- Target: 2:1, which is twice the 26-pip risk, or 52 pips above the entry.
The better entry price gives you a tighter stop and more room to the target. The cost is that strong moves often leave without pulling back. The facts for this example do not show whether price ever came back to the midpoint. If it did not, you simply missed the trade.
Setup 3: Sell a bearish engulfing at resistance
The chart below shows an uptrend stalling under a resistance area, followed by a bearish engulfing candle.
- Entry: sell at the close of the engulfing candle.
- Stop loss: a few pips above the engulfing candle's high, as the stop line in the drawing shows. Risk = 24 pips.
- Target: 1:1, which is 24 pips below the entry. In this drawing, price reaches it three candles after the signal.
What matters in this setup is where the candle forms. The same candle in the middle of the rally would not be worth trading.
When the engulfing pattern works and when to skip it
It works best on the 1-hour, 4-hour and daily charts: at a clear level, after a stretched move, and when the engulfing candle is clearly bigger than the candles around it.
Skip it on 1-minute and 5-minute charts, where market noise (random small price swings) creates engulfing shapes all the time. Also skip it inside a tight sideways range, just before major news, and when a stop beyond the pattern would be too wide for your account.
| Aspect | Pro | Con |
|---|---|---|
| Spotting | Two candles, easy to see on any chart | Shows up so often that many are meaningless |
| Stop placement | Natural stop beyond the pattern's extreme | A large engulfing candle forces a wide stop |
| Timing | Signal is complete at the candle close | Entering at the close can be far from the low |
| Context | Combines with any level or trend tool | Means little on its own |
Bullish vs bearish engulfing
A bullish engulfing is a bearish candle followed by a larger bullish candle whose body covers it, after a decline. It suggests buyers have taken over.
A bearish engulfing is the mirror image: a bullish candle followed by a larger bearish one after a rally. It suggests sellers have taken over.
Practical tips for trading engulfing candles
- Mark your levels before the candle forms. If you go looking for a level after you see the pattern, you will always find one.
- Compare the body with the last 10 candles. If it is not one of the biggest, treat it as ordinary noise.
- Check the next higher timeframe. A 1-hour bullish engulfing inside a falling daily trend is a short-lived pullback trade at best.
- Size from the stop. Money at risk ÷ (stop pips × pip value per lot), as in the calculation above.
- Write down the invalidation price. A close beyond the far end of the pattern ends the idea, whatever your target.
- Respect the weekend. A Friday signal, like the EURUSD example, carries gap risk into Monday.
Quick checklist before you buy or sell
- Prior move and a key level both present?
- Opposite color, second body covers first body, candle closed?
- Close near the candle's high (bullish) or low (bearish)?
- Stop beyond the pattern and lot size calculated from it?
FAQ
Why does an engulfing pattern show on one chart but not on another?
Daily and 4-hour candles depend on the time each candle starts and ends. Two charting services that use different start times draw different candles, so a pattern can appear on one and not the other. Go by your broker's candle times, because that is where your orders fill.
How long does an engulfing signal stay valid?
Treat it as fresh for the next few candles only. If price neither follows through nor breaks the pattern, the moment has passed. Cancel pending orders instead of leaving them open for days.
Does an engulfing candle need high volume to count?
Spot forex has no central exchange, so most forex charts show tick volume, which counts price changes rather than traded size. Rising tick volume can support the signal. Do not throw out a clean pattern at a strong level just because tick volume is flat.