









How to Read Forex Charts: Candlesticks, Trends and Timeframes
To read a forex chart, treat each candlestick as four prices for one period: open, high, low and close. The thick body runs from open to close, and the thin wicks reach the high and low. Green means price closed higher, red means lower. This works on every timeframe. Zoom out to find the trend: higher highs and higher lows mean up, lower highs and lower lows mean down.
Every entry, stop and exit you place in forex comes from this reading. Misread a wick and your stop sits where price has already traded. Act on a candle that hasn't finished and you put money behind a move that never happened.
What a forex chart is plotting
Each chart shows one currency pair, such as EUR/USD. The vertical axis is the price: how many units of the second currency buy one unit of the first, the base currency. The horizontal axis is time. When the chart rises, the base currency is gaining against the other currency.
Most charts are drawn from the bid price, the price you can sell at. Buy orders fill at the ask, which sits slightly higher. So the stop on a short trade can be hit at a level the bid-based candle never quite touched. When you see that happen, it doesn't mean the chart is wrong. It's the spread.
The same prices can be drawn in three ways:
| Chart type | What each period shows | What it is good for |
|---|---|---|
| Line chart | Only the closing price, joined into one line | Seeing the overall direction with little noise. It hides the highs and lows. |
| Bar chart | A vertical line from high to low, a tick on the left for the open and a tick on the right for the close | Full data, but there is no filled body, so it's slower to read |
| Candlestick chart | A body from open to close, wicks to the high and low, coloured by direction | Full data that you can read at a glance. This lesson uses it. |
The drawing below plots the same four periods all three ways. Look at the third period: its low drops further than any other period's, yet the line chart, which joins closes only, skips it completely.
How to read one candlestick
The body is the thick part. It covers the range between the opening and closing price of the period. The wicks (also called shadows) are the thin lines above and below it. The top of the upper wick is the highest price of the period, and the bottom of the lower wick is the lowest.
Colour tells you which end of the body is which. On a green candle, price closed above where it opened, so the bottom of the body is the open and the top is the close. On a red candle it's the other way round. The drawing below shows both.
Some charts show rising candles as hollow and falling candles as filled instead of green and red, and anyone can change the colours. Before you read anything, check which style your chart uses for a rising candle.
One limit catches many beginners. A single candle doesn't tell you the order things happened in. A green candle with a long lower wick might have dropped first and then rallied, or rallied first and then dropped and partly recovered. If the order matters, look at a shorter timeframe.
The last candle on your chart is still forming. Its body, its wicks and even its colour keep changing until its period closes, so read only closed candles.
Worked example: read one candle in pips
A pip is the standard unit of price movement. On most pairs it is the fourth decimal place, 0.0001 (on yen pairs it is the second decimal). To turn a price difference into pips, multiply it by 10,000.
The figures here are an illustrative example. Say a 1-hour EUR/USD candle opens at 1.1000, rises to a high of 1.1040, dips to a low of 1.0990 and closes at 1.1030. It closed above its open, so it's a green candle.
- Body: (1.1030 − 1.1000) × 10,000 = 30 pips
- Upper wick: (1.1040 − 1.1030) × 10,000 = 10 pips
- Lower wick: (1.1000 − 1.0990) × 10,000 = 10 pips
- Full range, low to high: (1.1040 − 1.0990) × 10,000 = 50 pips
The most useful number is where the close sits inside that range. The close is 40 pips above the low, out of a 50-pip range. That puts it 80% of the way up.
Use this rule on any candle:
- Close in the top quarter of the range: buyers held control right into the close.
- Close in the bottom quarter: sellers held control.
- Close in the middle half: neither side won that period.
The candle in the example closed in the top quarter. That's a description of what happened, not a promise of what comes next.
The three candle shapes to learn first
Long body, small wicks. One side pushed price in one direction for most of the period, and the other side barely fought back.
Long wick on one side. Price travelled there and got pushed back before the close. A long upper wick shows that higher prices were rejected. A long lower wick shows that lower prices were rejected.
Small body with wicks on both sides. Price moved both ways and closed near where it opened. When the open and close are almost equal, the candle is called a doji. It signals indecision.
The drawing below shows all three.
These shapes work on any timeframe; beginners should start with 1-hour and daily (see the table below).
Most named patterns, such as the hammer and shooting star, are these shapes at a particular place; others, such as the engulfing pattern, compare two candles. In an engulfing pattern, the second candle's body covers the first candle's body.
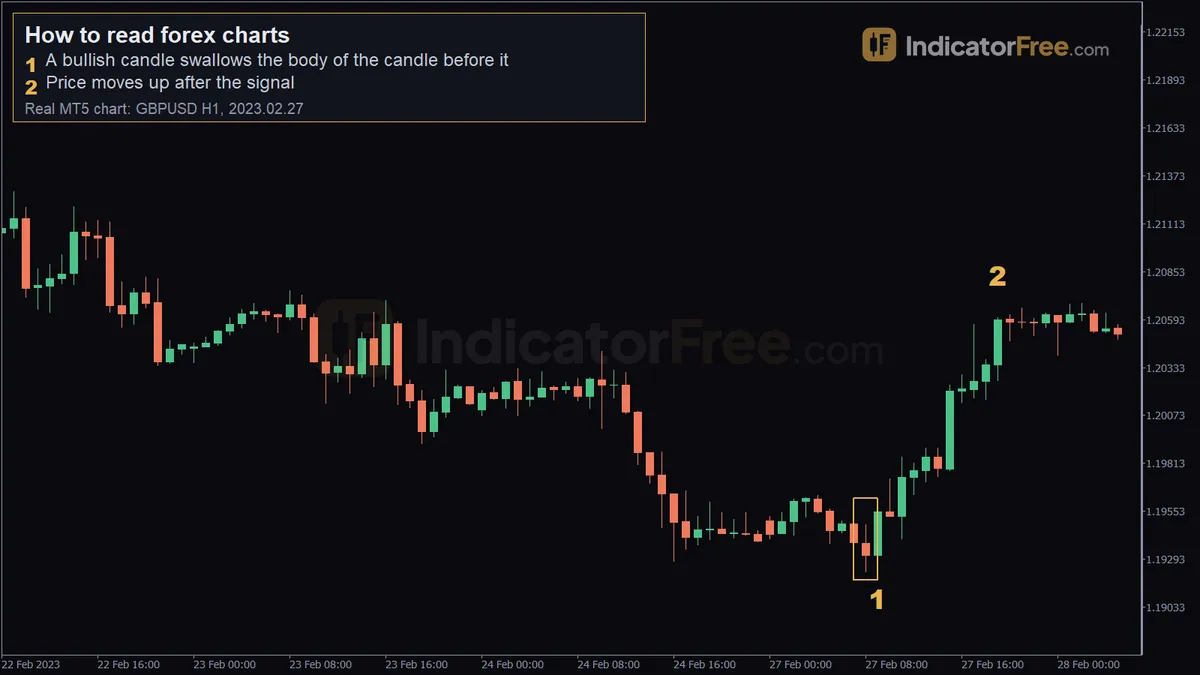 Real GBPUSD H1 chart from MetaTrader 5, a past example, not a forecast. 1 - a bullish candle swallows the body of the candle before it; 2 - price moves up after the signal.
The chart above is a past example, not a prediction. It shows 1-hour candles of GBP/USD. Marker 1 sits at 1.19283, the low of the candle that opened at 09:00 on 27 February 2023. That candle opened at 1.19314, dipped to 1.19283, rose to a high of 1.19577 and closed at 1.19549. Its green body swallows the body of the candle before it, and it closed in the top quarter of its range. Marker 2, at 19:00 the same day, shows price at 1.20603. Over the next 10 candles, price moved 105 pips up. All ten candles fall on the same Monday, so no weekend gap sits inside that move. That is what happened that time. The same shape can just as easily be followed by a drop.
You don't need to memorise dozens of names. If you can measure body, wicks and close location, you can read a candle you've never seen named.
A shape only means something where it forms. A long lower wick in the middle of a range tells you little. The same wick at an old swing low, in an uptrend, is worth your attention. The next section shows where those places are.
Find the trend with swing highs and lows
A swing high is a peak with lower highs on both sides of it. A swing low is a dip with higher lows on both sides. Trends are defined by these turning points, not by single candles.
- Uptrend: each swing high is higher than the last, AND each swing low is higher than the last.
- Downtrend: each swing high is lower than the last, AND each swing low is lower than the last.
- Neither: if only one condition holds, for example higher lows but lower highs, price is squeezing. Don't call a trend yet.
The chart below shows an uptrend. Each pullback stops above the previous one, and each rally breaks the previous peak. Look at the old swing high. Once price breaks above it, that level acts as support. On the later pullback, a candle dips just under the line, leaves a long lower wick and closes back above it.
To draw a trend line in an uptrend, connect two or more swing lows under the price. That gives you a rising support line. In a downtrend, connect two or more swing highs above the price to get a falling resistance line. The more swing points the line touches without cutting through candles, the more weight traders give it. Extend it to the right to see where price may react next. To practise, connect Swing low 1 to the first Higher low in the chart above and extend the line to the right. The second Higher low stays above it, so the line still holds.
You also need a rule for when the trend ends. If a candle closes below the most recent higher low, stop calling it an uptrend. In a downtrend, the mirror rule applies: a close above the most recent lower high. Count the close only. A wick through the level doesn't count.
Choose your timeframe before you read a single candle
Candles and the shapes above read the same way on every timeframe. A long lower wick means the same thing on a 5-minute chart as on a daily chart. What changes is how much trading each candle holds. A daily candle sums up a full day of buying and selling, while a 5-minute candle holds far less trading, so one burst of orders or a news spike can shape it.
A candle on a higher timeframe is several smaller candles merged into one. The drawing below shows four 1-hour candles building one 4-hour candle. The 4-hour open is the first candle's open. The 4-hour close is the last candle's close. The high is the highest high of the four, and the low is the lowest low. Notice that the red third hour leaves no trace of its colour in the 4-hour candle.
So choose your timeframes for how you trade, and choose them before you open the chart:
| Trading style | Chart for direction | Chart for timing entries |
|---|---|---|
| Swing trading (holding for days) | Daily, with weekly for context | 4-hour |
| Day trading (closed the same day) | 4-hour or 1-hour | 15-minute |
| Learning to read charts | Daily | 1-hour |
If you are new, start with the learning row: the daily chart for direction and the 1-hour chart for timing. Move down to the day-trading row only when you can read those two without hesitating. The table never goes below the 15-minute chart, and neither should you.
Always read from the top down. Set the trend label on the direction chart first, then look for setups only in that direction on the timing chart. If the direction chart has no clear trend, treat any trend on the smaller chart as weak.
Candle size also depends on the time of day, because forex trading sessions bring different amounts of activity. The hours when London and New York are both open are typically the busiest and most volatile window of the day. A 15-minute candle from that overlap and one from the quiet hours aren't comparable, so judge a candle's size only against candles from the same time of day. The timeline below shows the four main sessions and where London and New York overlap.
A five-step routine to read any chart
- Check the basics. Confirm the pair, the timeframe and which colour means a rising candle.
- Label the trend on your direction chart. Mark the last two swing highs and the last two swing lows, and write uptrend, downtrend or neither.
- Mark the nearest levels. Draw lines at the closest old swing high above price and the closest old swing low below it.
- Read the last few closed candles on your timing chart. Near a level, check body size, wick length and where each candle closed in its range.
- Write one sentence. For example: "Daily uptrend, price is back at an old high now acting as support, and the last 1-hour candle has a long lower wick and closed in its top quarter." If you can't write the sentence, you don't have a read, so don't place a trade.
Mistakes that cost beginners money
Calling a trend from one big candle. A single long green body feels like the start of an uptrend, but one candle has no swing points, so it can't define a trend. You've made this misread if you've written "uptrend" but can't point to two rising swing lows. The cost is buying after the burst is already over, with a stop far below at that candle's low. In the uptrend chart above, which is an illustrative diagram and not real price data, the largest candle has a 30-pip range, yet the trend label comes from the marked lows under price, not from that candle. Before you write the label, name the last two swing lows. If you can't, there is no label to write.
Judging a candle by how tall it looks on screen. Most charts rescale the price axis to fit whatever is visible. Zoom in on a quiet stretch and a small candle fills the screen. Before you call a candle big, measure its range in pips, the way the worked example does, and compare it with the candles around it.
Reading a weekend jump as a strong candle. The forex market closes over the weekend, but news and orders keep building while it is shut. So Monday's first candle can open well away from Friday's close, which makes it look huge or out of place. The distance between Friday's close and Monday's open was never traded. It isn't part of any body, so it shows no buying or selling you can measure. And because no trading happened in that space, a stop placed inside it can fill at the first available price beyond it, not at your level. The rule: measure Monday's first candle from its own open, not from Friday's close, and don't treat the gap as a breakout until a later candle closes beyond the level.
Acting on a candle that hasn't closed. A candle that looks like a strong green body with ten minutes left can finish as a doji or turn red. Its low isn't fixed yet either. A stop placed just under it can end up inside the finished candle if price dips again before the period ends. You can spot a forming candle because it is the last one on the right and no new candle has started after it. The cost is a trade built on a shape that no longer exists once the period ends. Ask whether the next candle has opened. If it hasn't, the shape you're looking at isn't final.
Selling the first wick through the higher low. Price spikes under the last higher low, you read it as the end of the uptrend, and you exit or go short. Then the candle closes back above the level, and you've sold close to where buyers stepped in. You spot the misread by looking at where the body finished, not where the wick reached. The test is one question: has a candle closed below the level? Until one does, the uptrend label stands.
Taking a 5-minute signal against the daily trend. A long lower wick on a 5-minute chart looks like a buy, but the daily chart shows lower highs and lower lows. The 5-minute candle holds a few minutes of trading, and the daily trend holds far more. You've made this misread if you can't say what the daily label was when you entered. The cost is buying straight into the selling that built the daily lower highs. Before any entry, write the direction-chart label next to the trade and skip setups that point the other way.
Sizing a stop from quiet-hours candles. You measure the last few candles during the quiet hours, see small ranges and set a tight stop to match. Then the London–New York overlap, roughly 13:00 to 17:00 GMT, brings candles that can cover that distance in one move. You spot this misread by checking what time of day the candles you measured came from. The cost is a stop hit by ordinary overlap movement, not by a real change in the trend. Base the stop on candles from the hours when your trade will actually be open.
FAQ
Why does my daily candle look different from the one on another chart?
Each platform draws candles from its own server clock. If two charts start the trading day at different hours, their daily candles hold different stretches of trading, so the open, high, low and close can all differ. Compare charts only when they use the same time zone.
Can I practise reading charts without risking money?
Yes. A demo account shows live prices with virtual money. Use it to run the five-step routine on closed candles and write down your sentence, then check later what price did. Treat it as practice in reading, not as proof that a method works.
Does a red candle mean price is going down?
No. A red candle only tells you that one period closed below its open. Uptrends are full of them: in the illustrative uptrend chart above, which is a diagram and not real price data, 6 of the 17 candles are red, and the trend still holds because the swing lows keep rising. Read the colour together with the swing points, never on its own.
Do I need indicators to read a forex chart?
No. Candles, swing points and the levels you draw from them are the raw read, and most indicators are calculated from the same open, high, low and close prices. Learn to read the candles first, so that you can judge whether an indicator is telling you anything new.
How do I count pips on a USD/JPY chart?
On yen pairs the pip is the second decimal place, 0.01, so multiply the price difference by 100 instead of 10,000. As an illustrative example, a candle that opens at 150.20 and closes at 150.50 has a 30-pip body. Everything else, including wicks, range and close location, is measured the same way as on EUR/USD.
Technical analysisNext lesson →
How to Read Candlestick Charts: Bodies, Wicks and Shapes Explained
Part of Forex basics: more guides, terms and free tools on this subject.