









Doji
Also called Doji candle, Doji candlestick, Doji pattern
A doji is a candlestick whose open and close are at, or almost at, the same price. It has a tiny body and wicks on one or both sides, which shows that buyers and sellers ended the period in balance.
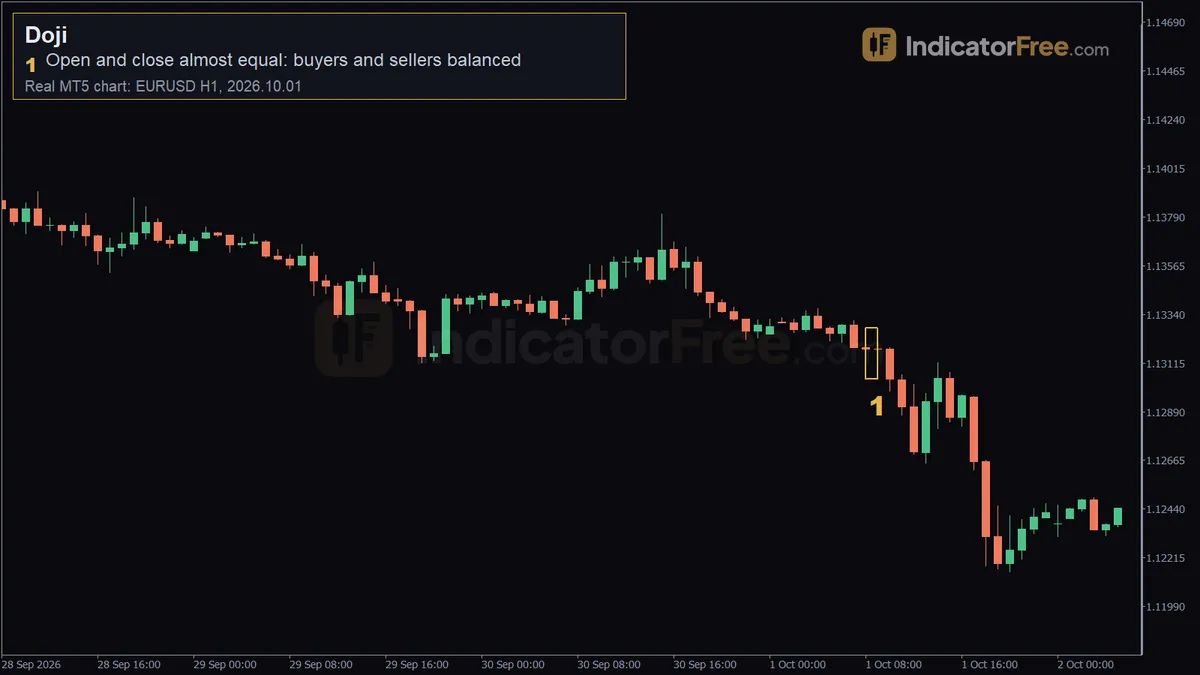
A doji on its own does not tell you to buy or sell. It tells you that the side pushing price has stopped winning. Treat it as a reason to stop adding in the trend's direction and to wait for the next candle before you act. If you reverse on the doji alone, you lose every time the trend simply carries on.
How to spot a doji: a 5-point checklist
- Body size. The gap between open and close is tiny compared with the candle's full range from high to low. A workable rule: the body is no more than about a tenth of the range.
- Wicks. There is a wick (the thin line showing prices that traded beyond the body) on at least one side. Where the wicks sit tells you which version of the doji you are looking at.
- Range. The candle's range is normal or larger for that chart. A tiny candle with a tiny body only means the market was quiet. It is not a doji worth reading.
- Location. It forms after a clear move, or at a level you had already marked: support, resistance, or a recent swing high or low.
- Closed candle. Judge it only after the candle has closed. While a candle is still forming, open and close can be equal for a moment and then end many pips apart.
Reading the EURUSD 1-hour doji from 1 October 2026
The chart at the top of the page is a past example from the EURUSD 1-hour chart, not a prediction. The 09:00 candle on 2026.10.01 opened at 1.13181, rose to 1.13251, fell to 1.13067 and closed at 1.13180.
Marker 1 sits at 1.13067, the candle's low, and labels the pattern: open and close almost equal, buyers and sellers balanced. The body is one point, or 0.1 pip. Within the hour, both sides tried to take control and both were pushed back to where the hour started.
The drawing below splits the candle into its parts so you can redo the arithmetic.
- Full range: 1.13251 − 1.13067 = 0.00184, which is 18.4 pips.
- Upper wick: 1.13251 − 1.13181 = 7.0 pips.
- Lower wick: 1.13180 − 1.13067 = 11.3 pips.
- Body share: 0.1 ÷ 18.4 = about 0.5% of the range, well inside the one-tenth rule.
The lower wick is longer, so sellers got further than buyers before they were pushed back. That hints that buyers were defending lower prices. On its own it is only a hint, not a signal. The facts cover this one candle, so what happened next is not part of the example.
Strong doji vs weak or broken doji
A doji is strong when three things line up:
- It appears after a stretched move into a level you marked in advance.
- Its range is at least normal for the session.
- The next candle closes clearly beyond its high or low.
Together they say the same thing: the move ran into a real wall.
A doji is weak when it prints in the middle of a sideways range, where indecision is the normal state. It is also weak during quiet hours, when every candle shrinks, and just before a major news release, when traders are simply waiting.
A doji is broken when price closes beyond it in the original trend's direction. Take a doji after a decline: if a later candle closes below the doji's low, sellers are back in control and any long trade idea built on it is cancelled.
Trading a doji: entry, stop loss and target
Both setups below are illustrative trade plans that risk 1% of a $10,000 account. They are examples of how to plan a trade, not results.
Setup 1: Breakout either way from the 1 October doji
This plan uses the real candle's high (1.13251) and low (1.13067):
- Buy side: a buy stop one pip above the high, with a stop loss just under the low.
- Sell side: a sell stop one pip below the low, with a stop loss just above the high.
The doji's range is 18.4 pips. Add about a pip of buffer at each end and, rounding up, each side risks 20 pips. Whichever order fills first, cancel the other one.
Target twice the risk: 40 pips from your entry, on whichever side fills. One standard lot (100,000 units) of EURUSD is worth $10 per pip, so the position size is the same for both sides.
Setup 2: Doji at support after a decline
The chart below shows the classic reversal version. Price falls into support and a doji forms with its low just under the line. The next candle then closes above the doji's high.
Here the doji's range is 18 pips. You buy at the close of the confirming candle, 17 pips above the doji's close. Your stop goes three pips under the doji low, so you risk 30 pips. A target at twice the risk sits 60 pips above entry. If the next candle had closed below the doji's low instead, there would be no trade.
Bullish and bearish dojis
A bullish doji forms after a decline, usually at support. It only counts once a later candle closes above its high.
A bearish doji forms after a rally, usually at resistance. It needs a later candle to close below its low.
Several named versions have their own glossary entries: the dragonfly doji, the gravestone doji, the long-legged doji and the four-price doji.
When a doji is worth trading and when to skip it
Dojis carry the most weight on 1-hour, 4-hour and daily charts, when they form after a strong move at a level you drew before the candle formed.
On the 1-minute and 5-minute charts that day traders use, dojis form all the time. Most of them are market noise: small random swings that carry no message.
Skip dojis inside a sideways range, during quiet hours and around scheduled news. Also skip a doji that forms against a strong trend with no level behind it, because trends often pause without turning.
| Pros | Cons |
|---|---|
| Easy to spot on any market and timeframe | Not a signal until the next candle confirms it |
| Its high and low give a clear level where the idea fails | Very common on short timeframes, so most are noise |
| Warns you before you add to a tired move | Often only a pause before the trend continues |
| Reads the same in forex, stocks and indices | Long wicks can force a wide stop |
Doji trading tips and a quick checklist
- Mark your levels first. A doji is useful when it confirms a level you already have. Don't use it to go looking for a level.
- Wait for the next candle to close. That one habit removes most false starts.
- Compare the doji's range with the candles around it. If it is smaller, the market was quiet, not undecided.
- Put your stop beyond the whole doji, wick included, plus a small buffer for the spread.
- If that stop needs more risk than your plan allows, trade a smaller size or skip the trade. Never move the stop inside the wick.
- Check the higher timeframe. A 1-hour doji that points against the daily trend needs a stronger level behind it.
Before you trade a doji:
- Is the body tiny and the range normal or larger?
- Is it at a level you marked, after a clear move?
- Has the next candle closed beyond the doji's high or low?
- Is your stop beyond the full wick, with the size matched to your risk?
FAQ
Should I close my open trade when a doji appears against it?
Not automatically, because a doji is a pause, not a reversal. A practical rule: if you are in profit and a doji forms at a level, move your stop to just beyond the doji. Close the trade only if a later candle closes beyond the doji against you.
What does it mean when several dojis form in a row?
The market is coiling. Neither side wants to commit, which often happens before news or a session open. Mark the highest high and lowest low of the whole group, and treat a close outside that box as the signal instead of any single doji.
Does a doji work the same way in stock trading?
You read it the same way. The difference is that stock prices often gap between sessions, so a daily stock doji only covers that day's open and close. Forex trades around the clock on weekdays, so its candles usually open right at the previous close.