









Fair value gap
Also called FVG, Imbalance, Price imbalance, Liquidity void
A fair value gap is a price range left behind by one fast candle. The wick of the candle before it and the wick of the candle after it do not overlap, so almost no two-way trading happened inside that range.
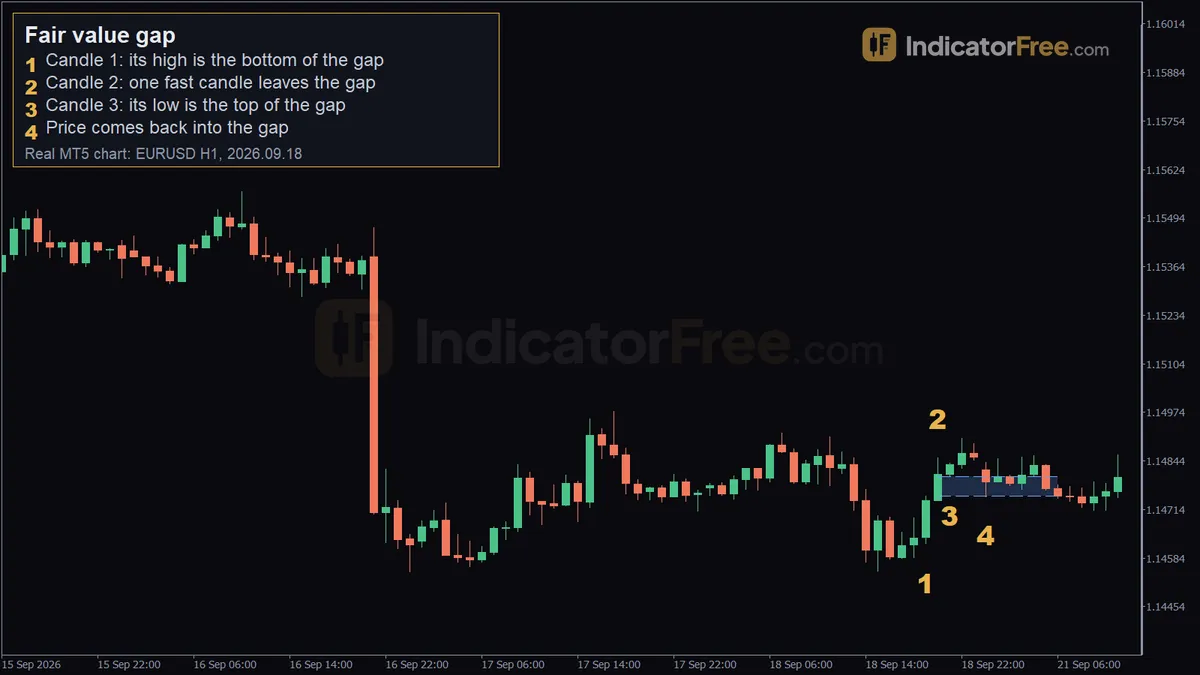
A fair value gap is the space one fast candle leaves behind. It matters because it marks a likely pullback zone, which gives you a defined entry and stop. Most traders mark it as a zone they expect price to come back to. Your stop must sit beyond the far edge plus a buffer, so a 5-pip gap can still need a 10-pip stop. It is not a trade signal on its own, and many gaps never hold.
How to spot a fair value gap: the three-candle checklist
- Find one strong candle (call it candle 2) with a body much larger than the candles around it.
- Look at the candle just before it (candle 1) and the candle just after it (candle 3).
- In an up move, the high of candle 1 must sit below the low of candle 3. In a down move, the low of candle 1 must sit above the high of candle 3.
- The space between those two wicks is the gap. Mark its top edge and its bottom edge.
- Wait for candle 3 to close. Until it closes, its wick can still reach back and erase the gap.
- Check whether price has already traded back into the zone. A fresh gap has not been touched yet. A touched gap has already been partly used.
You will meet a few more terms on other pages. Imbalance is another word traders use for the same gap. A bullish fair value gap forms in an up move and is watched as support. A bearish one forms in a down move and is watched as resistance. Consequent encroachment is the gap's midpoint, halfway between its two edges.
The chart below shows the pattern in a simple up move. The high of candle 1 and the low of candle 3 leave a band that no wick covers. Later, price dips into that band and then turns back up.
There are two common misreads. The first is drawing the gap from body to body. Do that and you will see gaps everywhere. Always use the wicks. The second is mistaking a weekend opening gap for a fair value gap. When Monday opens away from Friday's close, the space comes from the market being shut, not from one fast candle.
Reading the EURUSD 1-hour fair value gap, marker by marker
The chart at the top of the page is a past EURUSD 1-hour example, not a prediction.
- Marker 1, candle 1 (2026.09.18, 19:00). Marker 1 points to the candle, not to the edge price. Its high sets the bottom edge of the gap at 1.14751.
- Marker 2, candle 2 (20:00). One fast bullish candle, marked at 1.14852, carries price up. The wicks of its neighbours leave part of its range uncovered.
- Marker 3, candle 3 (21:00). Its low at 1.14803 sets the top edge. So the gap runs from 1.14751 to 1.14803, about 5 pips wide.
- Marker 4 (2026.09.21, 00:00). Price comes back down to 1.14749. That is 0.2 pip below the bottom edge, so the whole gap was traded through.
This example teaches two things. First, the gap formed on Friday, when one fast candle left it behind. Only the return came at the thin Monday open, in the first hour after the weekend, when few traders are active. Second, a stop placed exactly on the edge at 1.14751 would have been hit by a 0.2-pip overshoot, so always leave a buffer beyond the far edge.
Strong, weak and broken fair value gaps
A gap is strong when candle 2 breaks a recent swing high or low and closes near its extreme. It is stronger again when it points the same way as the trend on a higher timeframe and is still fresh.
A gap is weak when it forms inside a sideways range or points against the bigger trend. It is also weak when it is narrower than a normal candle on that timeframe, or when price has already tested it several times. Each test uses up the orders that were waiting there.
The drawing below puts the two cases side by side: a strong gap from a candle that breaks a swing high, and a weak, narrow gap inside a range.
A gap is broken when a candle closes fully beyond its far edge, for example below the bottom of a bullish gap. A wick that pokes through and closes back inside is not a break. Once a gap is broken, stop treating it as support or resistance.
An inverse fair value gap is a gap that price has closed through and that traders then use from the opposite side. For example, once a candle closes below a bullish gap, that broken gap can act as resistance when price rallies back up into it.
Trading a fair value gap retest
Limit buy at the top edge of the EURUSD gap
This plan uses the image's prices with a $10,000 account. The account size, the stop and the 1% risk are an illustrative example. You place a buy limit order at 1.14803, the top edge. Your stop goes 10 pips below your entry, which puts it 4.8 pips under the bottom edge (10 − 5.2). The chart gives no swing high above the gap to aim for, so you set a fixed target 10 pips above your entry, the same distance as your stop. One standard lot (100,000 units) on EURUSD is worth $10 per pip.
The numbers show the cost of a narrow gap. The gap is only 5.2 pips wide, but a stop safely beyond it needs 10 pips, so your target must sit 10 pips away just to reach 1 to 1. Here is a decision rule you can use: before you enter, find the nearest recent high above your entry. If it is closer to your entry than your stop is, price may stall there before your target, so skip the trade. Narrow gaps on the 1-hour chart often fail this test.
Confirmation entry inside the gap
Instead of leaving an order at the edge, wait for price to enter the zone. Then wait for a candle to close back in the gap's direction, like the reaction candle in the chart above. Enter at that close, put your stop below the lowest wick inside the gap, and aim for the prior high. In the chart above, that means entering at the reaction candle's close, a stop under its low wick, and a target at the earlier high. You get a worse price and miss trades that only touch the gap and leave. In return, you avoid many entries into gaps that are about to break.
When fair value gaps work and when to skip them
They tend to behave best in a clear trend, when the gap came from a break of structure, and when the return happens during active session hours. Skip them in sideways ranges, just before scheduled news and during thin holiday or weekend-open trading. The same rules apply in crypto. Crypto trades all week, so there is no weekend-open confusion, but liquidity still thins out at quiet hours.
| Pros | Cons |
|---|---|
| Clear three-candle rule that anyone can mark the same way | Appear constantly on low timeframes, and most mean little |
| Gives a defined zone for entry and stop | Price often trades straight through without reacting |
| Works on forex, indices, crypto and stocks | Narrow gaps often give poor reward-to-risk |
| Combines well with swing structure and order blocks | Where to enter (edge, midpoint, full fill) is a judgment call |
Practical tips for trading fair value gaps
- Mark gaps on the 1-hour or 4-hour chart first. Then drop to the 5-minute or 15-minute chart only to time your entry.
- Use the consequent encroachment as a check. In the EURUSD example it sits between 1.14751 and 1.14803, about 2.6 pips inside each edge. If candles close below the consequent encroachment of a bullish gap, the reaction is getting weaker.
- Be wary of a gap whose candle 2 is the news-release candle itself. That candle moved on one headline rather than steady buying or selling, and the next headline can push price straight through the gap.
- Keep a simple log of each gap you trade: its width, the session it formed in, and whether it held. Over time it shows you which gaps are worth your money on your own pair and timeframe.
Pre-trade checklist for a fair value gap
- Fresh: price has not traded back into the gap yet.
- Intact: no candle has closed beyond its far edge.
- Aligned: the trend on the higher timeframe points the same way as the gap.
FAQ
Does price always come back to fill a fair value gap?
No. In strong trends, many gaps are never revisited. Others are filled only days or weeks later. Treat a gap as a possible reaction area, not a promise.
Should I enter at the edge or the midpoint of a fair value gap?
The near edge fills more often, because shallow pullbacks only touch it. The consequent encroachment gives you a better price and a shorter stop, but you miss every pullback that turns before reaching it. Some traders split their size and place half at each.