









Imbalance
Also called Fair value gap, FVG, Imbalance zone, Price inefficiency
An imbalance is a price zone that one fast candle crossed because one side heavily outnumbered the other, leaving almost no two-way trading. On a chart it shows as a gap between the wicks of the candles before and after that fast candle.
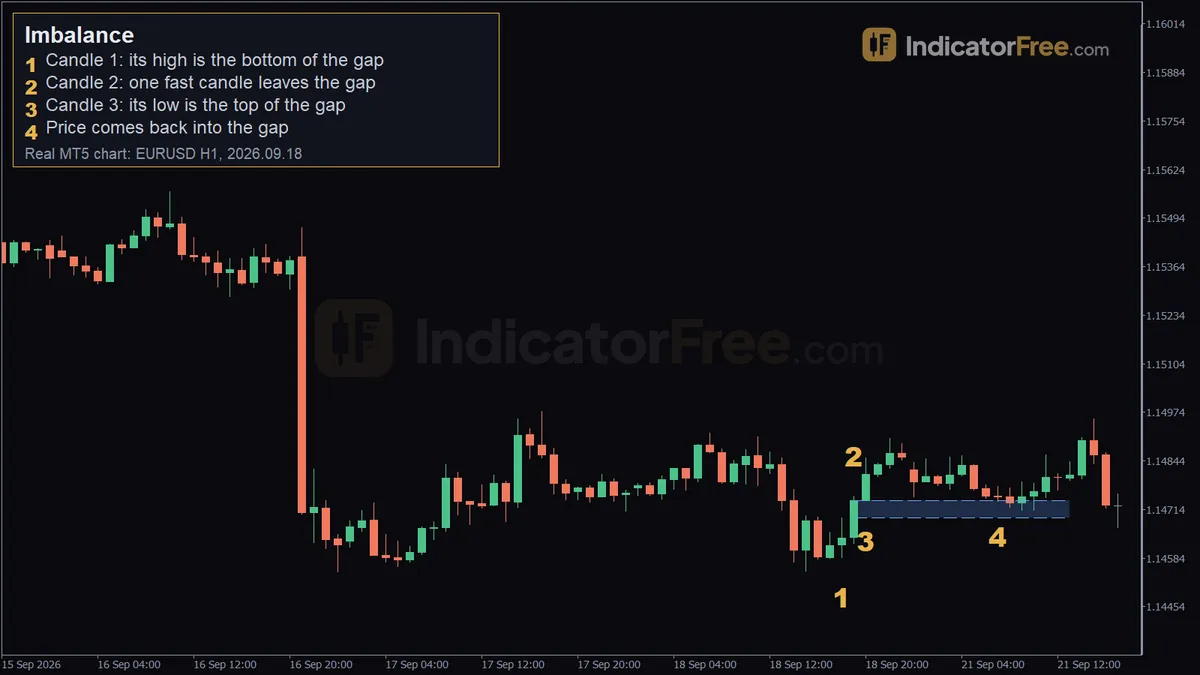
An imbalance matters because price often comes back to it. If you chase the fast candle, you usually get the worst price of the move. If you wait for the return, you trade at a set level with a stop you can measure in advance.
What balance and imbalance mean on a forex chart
In price action, balance means buyers and sellers are both trading at a price. The candles overlap and the market moves sideways. Imbalance is the opposite. One side takes over, and price jumps through a range of levels where almost no two-way trading took place.
In forex this shows up as a three-candle shape, often called a fair value gap (FVG). Traders mark it as an imbalance zone and expect price to come back and "rebalance" it later. That return is something to watch for, not a rule. Some gaps stay open for a long time.
A smaller version is the volume imbalance. Two candles next to each other have a gap between their bodies, but their wicks still overlap. The idea is the same, but the zone is thinner and weaker. The drawing below shows both shapes side by side, with the zone shaded.
How to spot an imbalance: identification checklist
- Find three candles in a row. Call the middle one candle 2.
- Check that candle 2 has a large body compared with the candles before it. It should close near its high (up move) or near its low (down move).
- For an up move (a bullish imbalance), candle 3's low must stay above candle 1's high. For a down move (a bearish imbalance), candle 3's high must stay below candle 1's low.
- The space between those two wicks is the imbalance. Draw a box across it, starting at candle 1 and extending to the right.
- Mark the midpoint: (top + bottom) ÷ 2. Many traders treat it as the key level inside the zone.
- Check that no later candle has traded across the whole zone. If one has, the zone is filled.
A common misread: a big candle on its own is not an imbalance. If candle 3's wick reaches back down to candle 1's wick, there is no gap. Zoom in and compare the two wicks before you draw anything.
Reading the EURUSD 1-hour example marker by marker
The chart at the top of the page is a past EURUSD 1-hour example, not a prediction. It shows a bullish imbalance from Friday evening and price coming back to it after the weekend.
- Candle 1 (18 September 2026, 18:00 chart time). Marker 1 sits on this candle at 1.14585. Its high marks the bottom of the gap at 1.14692.
- Candle 2 (19:00). One fast candle runs up to 1.14751 and leaves the gap behind.
- Candle 3 (20:00). Its low at 1.14737 is the top of the gap. Because 1.14737 is above 1.14692, the wicks do not overlap, so the imbalance is valid.
- The return (21 September 2026, 07:00). Price comes back down to 1.14736, inside the gap.
Here is the size of the zone, so you can check it yourself. The width is 1.14737 − 1.14692 = 0.00045, which is 4.5 pips (the chart rounds it to 5). The midpoint is (1.14737 + 1.14692) ÷ 2 = 1.147145.
The return to 1.14736 went only 0.1 pip inside the top edge. It touched the zone but got nowhere near the midpoint. This is the lesson: decide before price arrives whether you enter at the edge or at the midpoint. A limit order at the midpoint would not have filled on this touch.
Valid, weak or broken: grading an imbalance
An imbalance is stronger when candle 2 also breaks a recent swing high or low. It is also stronger when the gap points the same way as the trend on a higher timeframe, and when price has not come back to it yet.
An imbalance is weaker when the gap is tiny compared with your spread and your normal candle size. It is also weaker when it formed inside a sideways range or during a news spike in a thin market. A third case is when price has already tapped it (entered it without filling it) once or twice. Traders treat each touch as weakening the zone.
An imbalance is broken when a candle body closes beyond its far edge. A wick that only fills the gap does not break it. For a bullish gap, broken means a close below the bottom. After that, stop treating it as support.
When the fast candle starts from an order block, the two zones often sit next to each other. Bullish and bearish order blocks have their own glossary entries.
Trading an imbalance retest: two entries compared
The figure below sets out the same past EURUSD 1-hour example as trade levels. It is a past example, not a prediction. Both setups use the same stop, under candle 1 at marker 1 (1.14585), and the same first target, candle 2's high at 1.14751.
The stop sits under candle 1 rather than just under the gap bottom at 1.14692. A wick can poke below the gap bottom without a body close, and under the grading above that does not break the zone. With the stop at 1.14692 instead, edge-entry risk would be 1.14737 − 1.14692 = 0.00045, or 4.5 pips. The reward would still be the same 1.4 pips.
Setup 1: limit buy at the top edge of the gap
Place a buy limit at 1.14737, the top of the gap. On the chart, price touched 1.14736. That is only 0.1 pip past your limit, so once you add the spread, a buy limit at 1.14737 may not have filled. This is a second reason to choose between edge and midpoint in advance: an edge order can miss by the size of the spread, and a midpoint order needs a deeper return. The stop loss is 1.14585 and the target is 1.14751.
Risk is 1.14737 − 1.14585 = 0.00152, or 15.2 pips. Reward is 1.14751 − 1.14737 = 0.00014, or 1.4 pips. Even if the order filled, the reward is less than one tenth of the risk, because the nearest target sat almost on top of the entry.
Setup 2: limit buy at the midpoint
Place a buy limit at the midpoint, 1.147145. Keep the same stop at 1.14585 and the same target at 1.14751.
Risk is now 1.147145 − 1.14585 = 0.001295, or 12.95 pips. Reward is 1.14751 − 1.147145 = 0.000365, or 3.65 pips. The ratio is better but still poor, and the order never filled, because the return stopped at 1.14736. Decision rule: if the entry leaves less than 1.5 times your risk to the target, skip the trade or wait for a farther target that makes the maths work.
The verdict on this example: both setups fail the 1.5× rule, so the right decision is to skip the trade. It is the textbook pattern, and still no trade. It also shows the catch: a nearby target can wipe out the benefit of a smaller stop.
Sizing the edge trade from the stop
Size the position from the stop distance, not from how confident you feel. The steps below use the setup 1 prices and a standard lot worth $10 per pip on EURUSD. The account size is an illustrative example.
When imbalance trading works and when to stay out
Imbalances behave best in a clean trend, right after price breaks structure, and during active, liquid hours. They are also easier to read on the 1-hour, 4-hour and daily charts than on the 1-minute chart, where small gaps appear all the time and mean little.
Stay out when the market is moving sideways and in the minutes around major news. Also stay out when the gap is so small that your spread covers a large part of it.
| Pros | Cons |
|---|---|
| Gives an exact zone and midpoint to plan the entry | Price may skip the zone or only tap its edge, as in the EURUSD example |
| Gives a place for the stop beyond the far edge, at a distance you know in advance | Many tiny gaps on small timeframes are just noise |
| Easy to check: the wicks overlap or they do not | Zones can break with no warning during news |
| Works with structure and order-block analysis | Confirmation entries often leave little room to the target |
Pre-entry checklist for an imbalance trade
- The wicks of candle 1 and candle 3 do not overlap, the zone has not been filled, and this is the first return to it.
- You took the gap from the higher timeframe, and it points with that timeframe's trend. Use a lower timeframe only to time the entry, and check that no major news is due.
- The midpoint is marked, and you have written down your entry (edge or midpoint), a stop beyond the far edge, and your target.
- Your position size comes from the stop distance, and the reward is at least 1.5 times the risk.
- If a body closes through the far edge, delete the zone and wait for a new one.
FAQ
Which timeframe's imbalance wins when a 1-hour gap sits inside a 4-hour gap?
The 4-hour gap sets the bigger picture. Use the 1-hour gap to fine-tune your entry inside it. If the 1-hour gap breaks but the 4-hour gap still holds, the larger trade idea still stands.
Can I trade imbalances on gold, indices or crypto?
Yes. The three-candle rule is the same on any candlestick chart. Measure the gap against that market's normal candle size, because a meaningful gap on gold is a very different size from one on EURUSD.