









Liquidity
Also called Liquidity pool, Stop liquidity, Buy-side liquidity, Sell-side liquidity
Liquidity is how easily you can buy or sell without moving the price. On a chart, traders also use the word for the clusters of stop-loss and pending orders that sit above swing highs and below swing lows.
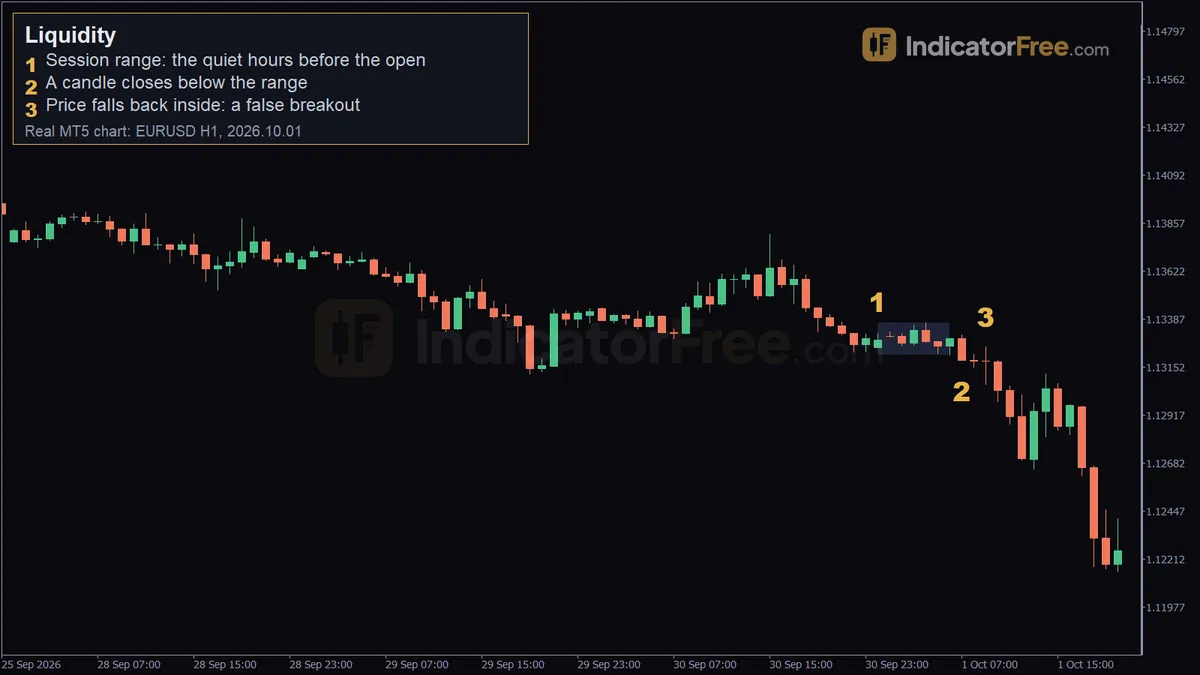
Your own stop-loss is part of that liquidity. Price often runs through the obvious stops just past a high or low, fills the large orders waiting there, and then turns. If you know where these clusters sit, you can keep your stop away from the crowd and avoid buying or selling into breakouts that fail.
Deep vs thin liquidity: what it does to your spread and fills
Market liquidity is how many buyers and sellers are active at a given moment. When it is deep, your order fills at the price you see. When it is thin, for example in the quiet hours before a major session opens or in the seconds around a news release, the spread widens. You may also get slippage, which means your order fills at a worse price than the one you clicked.
The same pair can be deep at one hour and thin at another:
| Deep liquidity | Thin liquidity | |
|---|---|---|
| Spread | Narrow and steady | Wider, and it can widen further without warning |
| Slippage | Rare and small; a normal order fills at or near the price you clicked | More likely; market orders and triggered stops can fill several pips away |
| How far price jumps between quotes | Small steps from one level to the next | Bigger gaps that skip the levels in between |
| Typical moments | Major pairs against the US dollar, such as EURUSD, USDJPY and GBPUSD, while the London and New York sessions are both open | Exotic pairs, the quiet hours before a session opens, the seconds around a news release, holidays |
What thin and deep liquidity mean for your orders
In deep liquidity, many orders wait close to the current price. A normal-size order gets absorbed without moving the price, and a stop-loss closes your trade close to the level you set.
In thin liquidity, few orders wait near the price, so price can jump from one quote to the next and skip the levels in between. Once your stop-loss is triggered, it becomes a market order and fills at the next available price. That can be beyond your level, and the loss can be bigger than you planned.
What to do about it:
- Check the spread before you enter. If it is wider than usual for that pair, wait until it narrows.
- In thin conditions, enter with a limit order. It fills at your price or better, or not at all.
- If you must hold a trade through a thin period, allow for some slippage when you work out your risk. The sizing example further down shows what 3 pips of slippage cost on 1 lot.
Buy-side and sell-side liquidity: the stops on your chart
Chart liquidity is what Smart Money Concepts (SMC) traders mean by the word. Short sellers put their buy stops above an obvious swing high, and breakout traders park buy-stop entries there too. Together these orders are buy-side liquidity. The sell stops and sell-stop entries below an obvious swing low are sell-side liquidity.
A large trader needs someone to take the other side of a big order. A cluster of stops gives them that, so price is often pushed into it before the real move starts. That push into the cluster is a liquidity sweep. Traders also call it a stop hunt or a liquidity grab.
Thin liquidity also makes sweeps easier. With fewer orders to absorb a push, a smaller push is enough to run price through a cluster of stops.
Where stop orders cluster on a chart
Stops gather where most traders would put them. That means just past equal highs or equal lows, past the edges of a tight range, past round numbers, and past the previous day's high and low. The more obvious the level, the more orders wait behind it.
The drawing below shows the idea. A range touches the same low twice. Then a candle spikes below and closes under it, price comes straight back inside, and it pushes on through the range high. The sell stops under the equal lows fed the spike.
How to identify a liquidity pool: a 6-step checklist
- Find a clear swing high, swing low or flat range edge that anyone can see without tools.
- Look for two or more touches at about the same price (equal highs or equal lows). Each touch adds more stops behind the level.
- Check that price has not traded through the level since it formed. Only an untouched level still has its orders.
- Check the timeframe. A level you can see on the 1-hour or 4-hour chart holds more orders than one you only see on the 1-minute chart.
- Mark the pool as a zone a few pips beyond the level, not as a single line, because stops are spread out.
- Act only after a candle CLOSES back inside within one or two candles; a wick back inside is not enough.
What makes a liquidity level weak or already spent
A pool is weak if the swing is tiny next to recent candles. A pool is spent once price has swept it. Those orders are already filled, so the next visit has less behind it.
A common misread is to call every wick past a level a sweep. A sweep candle can even close beyond the level. Apply step 6 of the checklist above. If later candles keep closing outside, it was a breakout, not a sweep.
The EURUSD 1-hour range break: why the wick back inside was not a sweep
The chart at the top of the page is a past EURUSD 1-hour example, not a prediction.
Marker 1, the session range. From 00:00 to 06:00 on 2026.10.01, price stayed between 1.13212 and 1.13368, a range of about 16 pips. Quiet hours like these form a tight box, and stops build up just above its high and just below its low.
Marker 2, a close below the range. The 07:00 candle closed at 1.13187, under the 1.13212 floor. A breakout trader reads this as a sell signal. At that moment the stops of traders who bought inside the range are being filled. Their stops are sell stops, so they add selling, and together with the new sellers' entries they push price lower.
Marker 3, a wick back inside, not a close. The chart label calls this a false breakout, but the closes say otherwise. The 09:00 candle wicked back up to 1.13251, inside the range, but it closed at 1.1318, still below the 1.13212 floor. The 08:00 candle had closed at 1.13181, and later closes kept falling: 1.1304 at 10:00, 1.12704 at 12:00 and 1.12187 at 19:00. No candle closed back inside the range, so under step 6 of the checklist this was a breakout, not a sweep. A buy at 1.13251 would have been stopped out as price fell to 1.12984 within the next hour. The rule says no buy, and it kept you out of a drop of more than 100 pips, from the 1.13251 wick to the 1.12187 close at 19:00.
Trading a liquidity sweep back into the range
If a candle had closed back inside: a hypothetical EURUSD sweep buy
This chart never gave the signal, but the plan is worth seeing. Suppose a candle had closed back inside the range at 1.13251. You would then trade toward the other side of the range, where the buy-side liquidity sits.
- Entry: buy only after a candle closes back inside the range. On this chart no candle did; for the example, assume one closed at 1.13251.
- Stop loss: a pip or two below the lowest point of the sweep. If price goes back under it, the setup is wrong.
- Target: the range high at 1.13368, where the buy stops of the range sellers sit.
Even with a close inside, the real 09:00 low at 1.13067 would have put the stop about 20 pips away against an 11.7-pip target, so the rule below says skip. The numbers that follow are an illustrative example, not what this chart did. Assume your stop ends up 10 pips below the hypothetical entry at 1.13251. Your account is $10,000 and you risk 1% on the trade. To see what thin liquidity costs, also assume your market buy slips and fills 3 pips above 1.13251 while the stop stays where it is.
In this example you risk 10 pips to make 11.7 pips, about 1.2 to 1, which is a thin margin. With 3 pips of slippage it becomes $130 at risk for $87, worse than 1 to 1. Use this rule: if your stop is farther from your entry than the range high is, skip the trade or aim for a target beyond the range high.
When liquidity sweeps work and when to stay out
Sweeps tend to be cleanest at the edges of tight ranges built in quiet hours, at equal highs or lows on the 1-hour chart and higher, and when the sweep happens as a busy session opens.
Stay out around high-impact news. Market liquidity thins out, spreads widen, and both sides of a range can get hit. Also avoid strong trends, where a break of a level usually keeps going, and thin holiday sessions. If the first two closes after the break stay outside the range, treat it as a breakout and stand aside, as the 08:00 and 09:00 closes on the EURUSD chart showed.
| Pros | Cons |
|---|---|
| Levels are visible on any plain price chart | Sweeps and real breakouts look the same at first |
| Stop placement is logical: beyond the sweep's extreme | The stop can be wide if the spike is deep |
| The opposite pool gives a clear first target | Range targets are often close, so reward is small |
| Teaches you where not to put your own stop | You must watch the closes at the level, so it takes screen time |
Bullish and bearish liquidity sweeps
In a bullish sweep, price takes the sell-side liquidity below a low, closes back above it, and you look to buy toward the highs. The EURUSD example above is the bullish version that never confirmed: no candle closed back above the range low.
In a bearish sweep, price runs the buy-side liquidity above a high, falls back below it, and you look to sell toward the lows. The zone where the reversal starts is often an order block, covered in the Bullish order block and Bearish order block entries.
Checklist before you trade a liquidity sweep
- Have you marked the previous day's high and low? They are the most widely watched pools.
- Has a candle closed (not just wicked) back inside the range? If that close is already well behind you, do not chase it. Every pip you pay above that close comes out of your reward.
- Is the next hour free of high-impact news?
FAQ
Does a quiet market mean my stop is safe?
No. Liquidity is how many orders wait near the price. Volatility is how far price moves. The two can move together or apart. In the quiet hours before a session opens, the market is thin and calm. In the seconds around a news release, it is thin and moves hard. In thin, calm hours a small push can still run your stop and fill it beyond your level.
Do liquidity sweeps happen on gold and indices too?
Yes. Traders put stops past obvious highs and lows in every market, so gold and stock indices show the same sweeps. Round numbers are watched closely there as well. A normal spike is a different size in each market, so judge the sweep zone against that market's own recent candles. Don't reuse a pip count from a forex pair.