









Round numbers
Also called Psychological levels, Big figures, Round levels, Double zeros, Whole numbers
Round numbers are prices that end in zeros, such as 1.1400 on EURUSD or 150.00 on a yen pair. Traders cluster stops, targets and pending orders around them, so price often stalls, reverses or speeds up there.
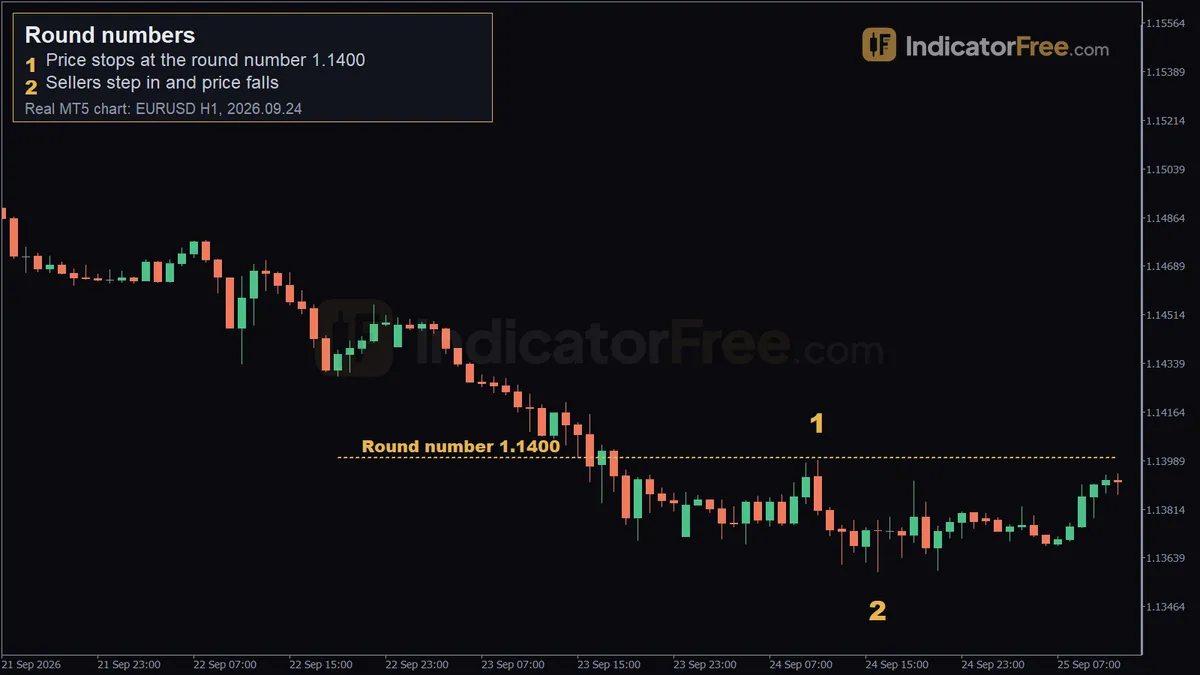
A round number is not a signal by itself. It is a place where many orders sit, so the useful question is what price does when it gets there. Read that reaction before you risk money, and you avoid the two classic losses: selling into a level that is about to break, and placing your stop exactly where everyone else placed theirs.
How to mark round numbers on your chart
- Find the big figures: prices where the last two digits of the normal quote are 00, such as 1.1400 and the next figure 100 pips above it. On yen pairs these are prices like 150.00 and 151.00.
- Add the half levels midway between them, 50 pips from each big figure. They attract fewer orders, so treat them as secondary.
- Rank the levels. The more zeros, the more attention: a price ending in three zeros outranks 1.1400, and 1.1400 outranks the half level 50 pips above it.
- Draw each level as a narrow zone, not a thin line. Price rarely turns on the exact digit.
- Keep only the levels price can reach today, and delete the rest.
- Note where a round number sits on top of another level you already trade, such as a prior high. That overlap deserves the most attention.
The figure below shows the grid around 1.1400. The shaded band is an example width; widen it on higher timeframes.
When a round number is worth trading and when it is not
A round number is valid when price arrives after a clear move, slows down inside the zone, and leaves a visible reaction. That reaction is usually a long wick or a candle that closes back on the side it came from. The first touch after a long absence is normally the cleanest.
It is weak when price has crossed it several times in the same session. Each crossing fills the orders resting there, so there is less left to stop the next one. A level in the middle of a tight sideways range is also weak, because price has no room to react.
It is broken when a candle closes clearly beyond the zone, not when a wick pokes through. Use this rule: if only the wick crossed, treat it as a rejection. If the body closed beyond the zone, stop fading the level and wait for a retest from the other side.
The EURUSD 1.1400 rejection, marker by marker
The chart at the top of the page is a past example on the EURUSD 1-hour chart, not a prediction.
Marker 1. On 24 September 2026 at 11:00, price reached a high of 1.13991. That is 1 pip below the round number 1.1400. Price never printed the level itself.
Marker 2. Sellers stepped in. By 16:00 the same day price was at 1.1359, a move of 40 pips down from the high. The chart facts count that fall within 15 candles.
Price turned just before the level, not on it. Sellers who waited for an exact 1.1400 fill were left behind. This is why you work with a zone.
There is a second lesson for stops. A short trade closes at the ask price, which sits above the price your chart draws by the spread. With the high at 1.13991, a spread of 1 pip would have put the ask just above 1.1400. A stop resting exactly on 1.1400 could have been hit even though the chart never showed that price.
Two round number setups with entry, stop and target
The prices in both setups are an illustrative example built around the 1.1400 level. They are not taken from a real trade.
Setup 1: fading the first touch
Price rallies into 1.1400 and a 1-hour candle closes back below the zone, 10 pips under the level.
- Entry: sell 10 pips below 1.1400, after the candle closes.
- Stop loss: 10 pips above 1.1400, which is 20 pips from your entry and above the zone, not on the round number.
- Target: the next half level down, which is 40 pips away.
You risk 20 pips to make 40. Size the trade from the stop, as the calculation below shows for a $5,000 account risking 1%.
Setup 2: break and retest
Price fails once at 1.1400, then a candle closes clearly above it. You do not chase. You wait for price to come back and test the level from above.
- Entry: buy 5 pips above 1.1400, after the retest candle dips to the level and closes back above it.
- Stop loss: 20 pips below your entry, under the breakout candle.
- Target: the next half level up, which is 45 pips from your entry.
The chart below shows the sequence: a failed first touch, the close above, then the retest that holds.
Where round numbers help and where they fail
Round numbers work best in active sessions, on the first touch, and when they line up with a level that price has already respected. They work poorly just before major news, when price can run through several levels in one candle. They also work poorly in a strong trend, where each round number tends to give only a brief pause.
| Pros | Cons |
|---|---|
| Known in advance, so you can plan before price arrives | Everyone sees them, so stops cluster and get swept |
| Objective: no settings and no opinion | Price often turns a little early or a little late |
| Natural places for targets and partial exits | Too many levels if you mark every half level |
| Same logic on every pair and timeframe | No direction by themselves: you still need a reaction |
Bullish and bearish round numbers
Bullish version: price falls to a round number, rejects it and closes back above. The level is acting as support.
Bearish version: price rises to a round number, rejects it and closes back below, as in the 1.1400 example. The level is acting as resistance.
A round number that breaks and then holds from the other side is a support and resistance flip. When it overlaps another level, that is confluence. Both have their own glossary entries.
Practical tips for trading round numbers
- Place stops beyond the zone, never on the 00. Add the spread on top for short trades.
- Set take-profit orders a few pips in front of the round number. Price often turns early, as it did 1 pip short of 1.1400.
- Wait for the candle to close. A wick through the level tells you nothing until the candle is finished.
- Count the touches. If price has already crossed the level several times today, skip it.
- Use the next round number as your target. It gives every trade a logical exit and a quick reward-to-risk check.
- If the distance to the next round number is smaller than your stop, do not take the trade.
Quick checklist before you trade one
- Is this a big figure or a half level, and is it the first touch?
- Did a candle close show rejection or a clean break?
- Is my stop outside the zone, with the spread allowed for?
- Is the next round number at least twice my stop distance away?
FAQ
Why do round numbers attract so many orders?
People think in simple prices. Traders set stops and targets at 1.1400, not at an odd price a few pips away, and large participants also quote and hedge around whole figures. This habit is what traders call round number theory. The orders pile up, and price reacts when it reaches them.
Which timeframe should I use for round number trading?
The level is the same on every timeframe; only the reaction changes. Many traders mark the levels on the daily or 4-hour chart, then read the reaction on the 1-hour or 15-minute chart. Lower timeframes give more false pokes through the level.
Do round numbers work on gold, indices and crypto?
Yes, the idea carries over, but the scale changes. Look for the prices that people quote in conversation, which are usually the whole hundreds or thousands on that instrument. Then check on the chart that price has reacted there before.
Do I need a round numbers indicator?
No. A horizontal line at each big figure does the job on any charting platform. An indicator that draws the grid only saves you the drawing time; it does not tell you whether the level will hold.