









Fibonacci retracement
Also called Fib retracement, Fibo retracement, Fibonacci levels, Fib levels, Fibonacci retracement levels
A Fibonacci retracement is a set of horizontal levels drawn across one finished price move, at 23.6%, 38.2%, 50%, 61.8% and 78.6% of its size. Traders use them to judge where a pullback may pause before the original move resumes.
The levels do not predict where price will turn. Their value is practical: they give you a short list of prices to plan around, so your entry, stop loss and position size are decided before the pullback arrives, not while you are chasing it.
How to draw a Fibonacci retracement, step by step
- Pick one clear, finished move on your timeframe. It should stand out without zooming in.
- In a rising move, anchor the tool on the swing low (the lowest point before the rise) and drag it to the swing high (the highest point before the pullback). In a falling move, drag from the swing high down to the swing low.
- Use the wick extremes for both anchors, and do it the same way every time.
- Your platform plots the levels between the two anchors. Each one is a percentage of the move that price has given back.
- Wait for the pullback. Most traders watch the area between 38.2% and 61.8%, and call 50% to 61.8% the golden zone.
- Treat a close beyond 78.6% as your warning to stand aside. A close beyond the start of the move (the 100% line) means the swing no longer exists.
If you do not plan around 23.6%, hide it to keep the chart readable. Keep 78.6% visible, because it is your stand-aside warning.
You can check any level yourself. The figures below are an illustrative example: a 100-pip rise on a USD-quoted pair.
For a falling move, add the amount to the swing low instead of subtracting it from the swing high.
What makes a retracement valid, weak or broken
A valid retracement sits on a move that is obvious, recent and in the direction of the larger trend. The pullback is slower and smaller than the move it corrects, and price shows a reaction at a level: a long wick, or a candle that closes back in the trend direction.
A weak one is drawn on a small, choppy swing inside a range. With several possible anchor points you can make a level fit almost any turn, which tells you nothing about the next one.
A broken one is when price closes beyond the start of the move. The swing you measured no longer exists, so remove the drawing and wait for a new swing.
The depth of the pullback is information too. Use it as a decision rule:
- If price turns at 23.6% or 38.2%, the trend is strong. Expect a small pullback and little time to enter.
- If price reaches 50% to 61.8%, this is a normal correction. This is where most planned entries sit.
- If price closes beyond 78.6%, that is your warning to stand aside. A close beyond 100% means the swing no longer exists.
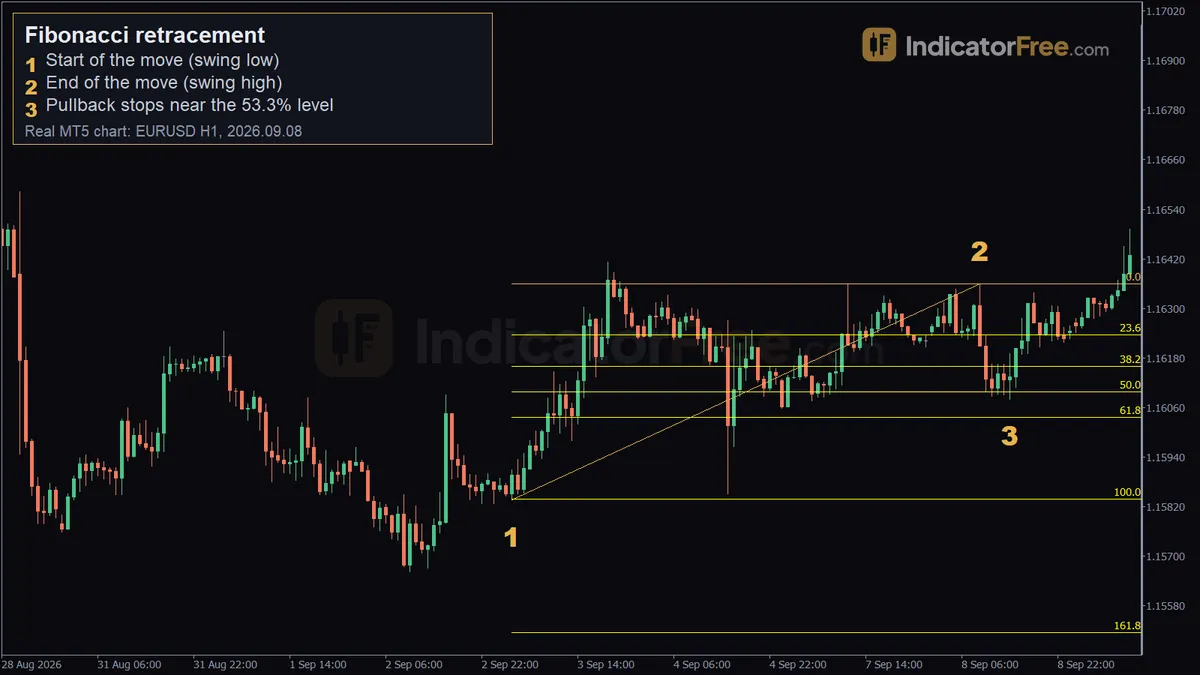
The EURUSD example at the top of the page, marker by marker
The chart is a past example on a 1-hour EURUSD chart, not a prediction.
Marker 1, the swing low. The move starts at 1.15836 on 3 September 2026 at 03:00. This is the first anchor.
Marker 2, the swing high. Price tops at 1.16358 on 8 September 2026 at 09:00. This is the second anchor. The measured move is 52 pips.
Marker 3, the pullback low. Five hours later, at 14:00, price stops at 1.16080. It has given back about 28 pips, which is 53.3% of the move. From there it rose 41 pips.
Notice what did not happen. Price turned at 53.3%, between the 50% and 61.8% levels, not on a line. A buy limit order resting at 61.8% would never have filled. This is the most common misread: the levels mark an area, and the turn usually lands somewhere inside it.
Two ways to trade a pullback into the golden zone
Both setups use the same illustrative 100-pip rise and an illustrative $5,000 account risking 1%, which is $50. A standard lot (100,000 units) on a USD-quoted pair moves $10 per pip. The chart below shows the first setup.
Setup 1: wait for a rejection candle
Price falls into the golden zone. One candle dips just under the 61.8% level and closes back at the 50% level with a long lower wick.
- Entry: buy at the 50% level as the next candle opens.
- Stop loss: 20 pips under the entry, a few pips under the wick low. Risk is 20 pips.
- Target: the swing high. Reward is 50 pips, or 2.5 times the risk.
- Size: 20 pips × $10 = $200 per lot. $50 ÷ $200 = 0.25 lots.
Setup 2: a limit order at the 50% level
Here you place the order in advance and accept whatever happens next.
- Entry: buy limit at the 50% level.
- Stop loss: 35 pips under the entry, beyond the 78.6% level. Risk is 35 pips. This is far enough even though the swing only breaks at 100%. A close past 78.6% already tells you to stand aside, so you gain nothing by risking 15 more pips while you wait for the swing low to give way. The stop sits a little past 78.6% so a single wick does not take you out before a close confirms the warning.
- Target: the swing high. Reward is 50 pips, about 1.4 times the risk.
- Size: 35 pips × $10 = $350 per lot. $50 ÷ $350 = 0.14 lots.
On the same chart, this order fills one candle earlier and then sits 14 pips in loss while the wick forms. You never miss the trade, but you pay with a wider stop, a smaller position and no evidence that buyers have shown up.
When Fibonacci retracement helps and when to leave it off
It fits trending markets with clean swings, where pullbacks are orderly. It adds the most when a level lines up with something independent, such as a prior support or resistance level or a demand zone. That overlap is called confluence.
Leave it off in a sideways range, around major news releases, and on any swing where you cannot decide which high or low to use.
| Pros | Cons |
|---|---|
| Gives planned entry areas before the pullback arrives | Anchor choice is subjective; two traders draw different levels |
| Defines clear warning and invalidation levels for the stop loss | Five levels mean price will always turn near one of them |
| Works on any market and timeframe with clear swings | No information about timing or direction on its own |
Bullish and bearish versions
Bullish retracement: drawn from swing low to swing high in a rising market. The levels sit below price and act as possible support for buying the pullback.
Bearish retracement: drawn from swing high to swing low in a falling market. The levels sit above price and act as possible resistance for selling the bounce.
Levels beyond the end of the move, used for profit targets, belong to the Fibonacci extension, which has its own entry.
Quick checklist before you take the trade
- Is the swing clear and finished, and does the trend one timeframe higher point the same way? If it points the other way, skip the setup.
- Has price reached the 38.2% to 61.8% area and shown a reaction?
- Is the stop beyond the level or wick that proves the idea wrong?
- Is the reward to the swing high or low larger than the risk?
- Is the position sized so a stop-out costs only your planned risk?
FAQ
Who invented Fibonacci retracement in trading?
No single person did. The tool is named after Leonardo of Pisa, known as Fibonacci, a medieval Italian mathematician who described the number sequence the ratios come from. He never applied it to markets. Technical analysts adapted the ratios to price charts much later.
Where do the 61.8% and 38.2% numbers come from?
In the Fibonacci sequence each number is the sum of the two before it. Divide a number by the next one and the result settles near 61.8%. Divide it by the number two places ahead and you get about 38.2%. The 50% level is not a Fibonacci ratio at all; traders keep it because half-way pullbacks are common.
Which timeframe is best for Fibonacci retracement?
There is no best one. The tool measures a swing, so it works wherever swings are clear. Swings on the 4-hour and daily charts are watched by more traders and contain less noise than those on a 1-minute chart, so levels there tend to be easier to read.
Should I draw from candle wicks or candle bodies?
Wicks are the common choice because they mark the true extreme of the move. Bodies give slightly tighter levels. The difference is usually a few pips, so consistency matters more than the choice.