Supply zone
Also called Supply area, Selling zone
A supply zone is a price area where sellers overpowered buyers and sent price sharply lower. You mark it from the last candle or small group of candles before the drop, then watch for price to come back to it and fall again.
If you draw the box in the wrong place, even a good zone can lose you money. Some traders box every small pause, and others keep using a level that price has already broken through. If you know what makes a supply zone valid, you know where a sell trade has a reason to exist. It also tells you where your stop loss belongs, so you are not guessing.
How to mark a supply zone: a 6-point checklist
Work through these steps in order. If any step fails, you have no zone and no trade. Draw zones on the 4-hour or daily chart first. Then go down to the 1-hour chart to fine-tune your entry.
- Find a sharp drop. Look for one or more large bearish candles with small wicks that carry price quickly away from an area. A slow slide downward does not count.
- Find the base. The base is the last bullish candle, or a small group of tight candles, just before the drop. This is where sell orders took control.
- Draw the box. The proximal line is the edge price reaches first on its way back up. Here that is the bottom of the base. The distal line is the far edge. Put it at the highest high of the base and the first drop candle, because that candle can spike above the base before it falls. Your stop goes a few pips beyond the distal line.
- Check that the drop broke structure. The drop should take out a recent swing low, such as the lowest low of the previous 10 candles. If it did not, sellers were not strong enough to change anything.
- Check that the zone is untouched. Price should not have traded back into the box since the drop. Every return uses up some of the waiting sell orders.
- Check the room below. Measure the distance from the proximal line down to the nearest support or demand area. If that distance is smaller than your stop distance, skip the zone.
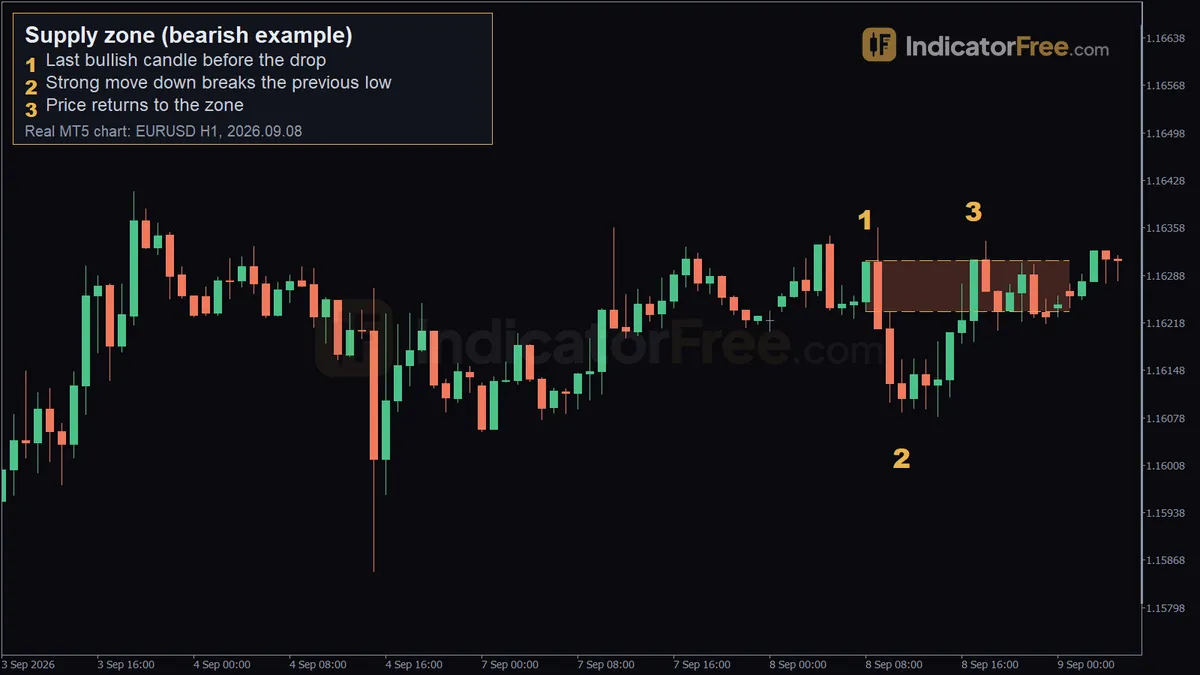
The chart below is a simplified drawing of these parts: the base candle, the fast drop through the prior low, and the later return into the box.
A common mistake is to box the big red candle itself. That candle is the result of the selling. The orders came from the base just before it, so draw the zone around the base.
What makes a supply zone weak or broken
How price leaves a zone matters more than how the zone looks. A drop that takes many small candles to cover a short distance shows sellers barely winning. Expect that kind of zone to give way.
Each return also weakens a zone. The first visit meets the most waiting sell orders. A third or fourth visit often breaks through.
A zone is broken when a candle closes above its distal line. Stop treating it as a place to sell. Broken zones sometimes turn into buying areas.
Two more warning signs: the zone sits against a clear uptrend on a higher timeframe, or the box is so tall that a stop beyond it would be bigger than any sensible target.
Reading the EURUSD 1-hour example, marker by marker
The chart at the top of this page is a past example from the EURUSD 1-hour chart on 8 September 2026. It is not a prediction.
- Marker 1, the base (08:00, 1.1631): this was the last bullish candle before the move down. Its range runs from 1.16234 to 1.1631. The first drop candle, at 09:00, reached a high of 1.16358 before it fell. That puts the distal line at 1.16358, so the zone runs from 1.16234 to 1.16358.
- Marker 2, the drop (11:00, 1.16086): over the next 3 candles, price fell 20 pips and broke the lowest low of the previous 10 candles. That is step 4 of the checklist.
- Marker 3, the return (17:00, 1.16311): price came back into the zone and went above the base candle's high. The 18:00 candle then pushed to 1.16338, which is 2.8 pips above 1.1631. After that, price moved 10 pips down.
The lesson is in marker 3. Price did not turn at the proximal line. The 18:00 wick to 1.16338 would have hit any stop placed just above the base candle's high of 1.1631. Your stop has to clear the highest wick of the base and the first drop candle, which on this chart is 1.16358. No candle closed above 1.16358: the 17:00 candle closed at 1.16311, and the 9 September 03:00 candle closed at 1.16324. So the zone was never broken.
Selling the first return to a supply zone
Setup: limit sell at the proximal line (EURUSD 1-hour, 8 September 2026)
The zone edges and the prior low below are real prices from the chart. The stop buffer and account size are an illustrative example.
- Entry: a sell limit order at the proximal line, 1.16234.
- Stop loss: a few pips above the distal line at 1.16358. The size of that buffer is your choice, so the stop sits more than 12.4 pips from entry, which is the height of the zone.
- Target: the low the drop made, 1.16086.
The steps below turn that plan into an order size for a $6,000 account risking 1%. On EURUSD, one standard lot (100,000 units) is worth $10 per pip.
The numbers show a problem. The reward is 14.8 pips and the zone alone is 12.4 pips tall, so any buffer bigger than 2.4 pips makes the risk larger than the reward. Use this rule: if the distance to the target is less than your stop distance, change the plan or skip the trade. One fix is to place the limit order at the middle of the zone, halfway between the proximal and distal lines. That cuts the risk by half the zone height, which is 6.2 pips. The stop distance drops from about 12.4 pips plus your buffer to about 6.2 pips plus your buffer. The reward grows by the same 6.2 pips, from 14.8 pips to 21 pips. The cost is that deeper orders get filled less often.
On this chart, price reached 1.16311 at 17:00 and 1.16338 at 18:00. That filled the proximal entry shown in the levels figure. It also went past the middle of the zone, 6.2 pips above that entry, where the mid-zone order would sit, so that order would have been filled too. Neither candle reached the distal line at 1.16358, so a stop placed above it was not hit. Price then moved 10 pips down. The chart does not show whether price went on to reach 1.16086.
Bearish by nature: the two kinds of supply zone
A supply zone always points to a sell. It comes in two forms. Rally-base-drop forms at a turn in direction: price rises, pauses, then falls. The chart at the top shows this form. Drop-base-drop forms inside a downtrend: price falls, pauses, then falls again.
The bullish version is the demand zone.
FAQ
How is a supply zone different from resistance?
Resistance is usually a line drawn through several highs where price stalled. A supply zone is an area built from one sharp drop. You judge it by how fast price left it, and it gets weaker each time price comes back.
What tool do I use to draw a supply zone on a chart?
Use the rectangle tool on any charting platform. Set the top at the distal line and the bottom at the proximal line. Stretch it to the right so you can see when price returns.
Can a supply zone form on a 1-minute chart?
Yes, the same rules apply on any timeframe. Zones on very short timeframes break more often, so it helps if they sit inside a zone from a higher timeframe.