









Pivot point
Also called Floor pivots, Classic pivot points, Daily pivots, Standard pivots, PP
A pivot point is a price level calculated from the previous period's high, low and close. Support levels (S1–S3) and resistance levels (R1–R3) are built around it, and traders use them as the day's likely turning points.
Every trader using the classic pivot point formula sees the same seven lines, so price often pauses or turns near them. If you know where they sit before the session opens, you know where not to chase a move and where your stop is most likely to be tested.
What the pivot levels show: P, R1–R3 and S1–S3
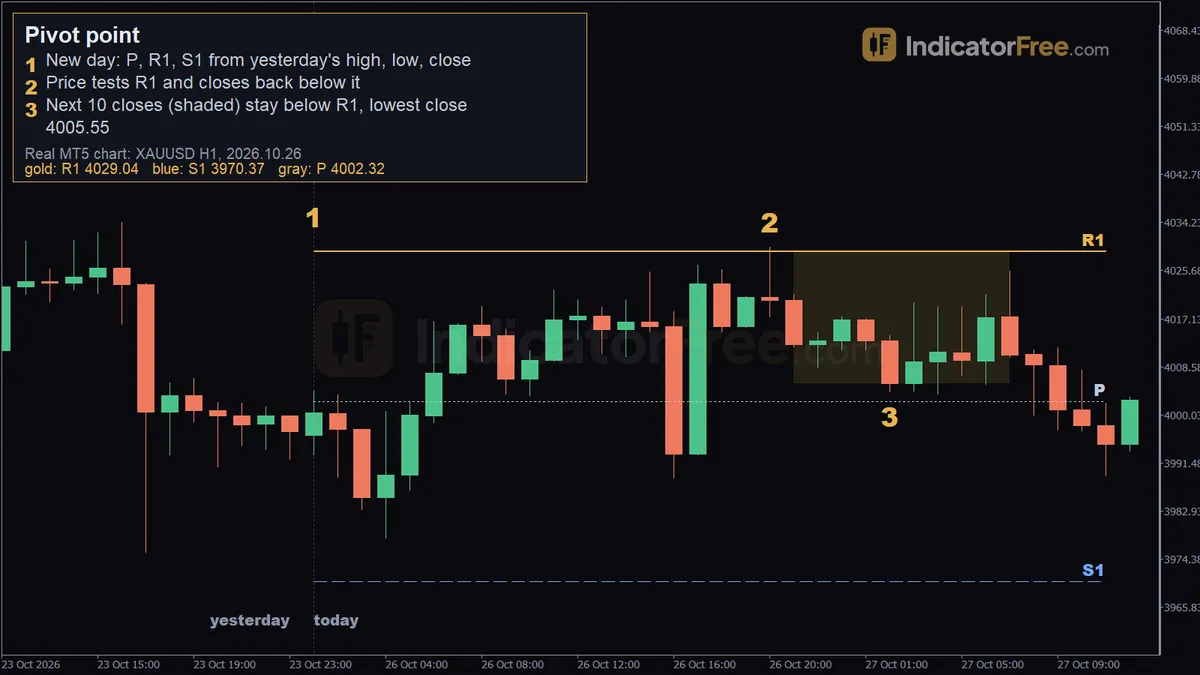
The levels are calculated once, when the new trading day opens. They stay fixed until the next day and do not update while price moves. The gold chart at the top of this page shows one set drawn on a 1-hour chart.
- P (the central pivot) is the average of yesterday's high, low and close. It works as the day's balance line: above it buyers have the edge, below it sellers do.
- R1, R2 and R3 (resistance) sit above P, where a rise may slow or turn. R1 is the nearest, so it is the first one price meets.
- S1, S2 and S3 (support) sit below P and work the same way for falls.
The farther a level sits from P, the bigger the move needed to reach it. R1 and S1 come into play on normal days, R2 and S2 on strong ones, and R3 and S3 mostly on trend or news days. The drawing below shows how one day's candle becomes the next day's map.
How pivot points are calculated from yesterday's high, low and close
You need three numbers from the previous day: the high (H), the low (L) and the close (C).
- P = (H + L + C) ÷ 3
- R1 = 2 × P − L, and S1 = 2 × P − H
- R2 = P + (H − L), and S2 = P − (H − L)
- R3 = H + 2 × (P − L), and S3 = L − 2 × (H − P)
The figures that follow are an illustrative example. Yesterday's high was 1.1120, the low was 1.1000 and the close was 1.1090. The calculation below turns those three prices into five of today's levels.
To finish the set: R3 = 1.1120 + 2 × 0.0070 = 1.1260, and S3 = 1.1000 − 2 × 0.0050 = 1.0900.
You can check any charting tool the same way. On the gold chart at the top of the page, the previous day had a high of 4034.28, a low of 3975.61 and a close of 3997.08. Put those into step 2 and R1 comes out at 4029.04, the same line drawn on the chart. If your numbers don't match your platform's, look at the day-close time first.
| Input | Common choices | What changing it does |
|---|---|---|
| Source period | Daily, weekly, monthly | Longer periods give wider levels that last for days or weeks instead of one session |
| Formula | Classic (floor), Fibonacci, Woodie, Camarilla | Changes the spacing. Fibonacci places levels at 38.2%, 61.8% and 100% of yesterday's range from P. Woodie counts the close twice: P = (H + L + 2C) ÷ 4 |
| Day-close time | Server time, New York 17:00, UTC midnight | Decides which candles count as the previous day, so every level shifts |
| Levels shown | P with R1/S1 only, up to R3/S3, plus mid-points | More lines give more targets but also more noise |
Reading pivot point signals
Price above or below P sets the day's bias
Watch which side of P price holds once the session gets going. If price holds above P, favour buys and treat R1 as the first target. If it holds below P, favour sells toward S1. If price keeps crossing P back and forth, the day has no bias, so skip trades from P in both directions. This bias rule is for trades that start at P. Fading R1 or S1 is a separate setup: it trades the rejection at the outer level, so it suits a two-sided day like the gold day in the worked example below.
A rejection at R1 or S1
A rejection is a candle that pushes through a level but closes back on the side it came from. The wick shows that orders beyond the level drove price back. Judge it only on the close. A level that looks rejected with ten minutes left in the candle can still close beyond it. The chart below shows the shape. It is an illustrative example that reuses R1 (1.1140) and P (1.1070) from the calculation above, not real market data.
A breakout through a level
A breakout is a candle that closes beyond the level. A wick alone does not count. The stronger version is a close beyond the level, then a pullback that tests it from the other side and holds. At that point old resistance is working as support, and the next level up becomes the target.
The common misread is a long wick above R1 with the close back below it. That is a rejection, not a breakout. Traders who buy the wick often buy near the high of the move.
The next level as a profit target
Pivots give you ready-made exits: a buy from S1 aims at P, and a buy from P aims at R1. Before you enter, measure the distance to the next level and compare it with your stop. If the target is less than about 1.5 times the stop distance, the trade does not pay enough for the risk. Skip it.
Selling an R1 rejection on gold (XAUUSD): 1-hour chart, 26 October 2026
This is a past example from the chart at the top of the page, not a prediction. R1 for the day was 4029.04.
Marker 1, the new day (2026.10.26 01:00). P, R1 and S1 were set from the previous day's high, low and close. The first candle traded up to 4004.21, right around the central pivot, so the session opened with no clear bias. Price climbed through the day, and the 2026.10.26 17:00 candle reached 4026.72, close to R1 but not through it. Price did not hold one side of P (4002.32): the early candles closed below it, the 06:00 candle closed back above at 4007.5, and the 16:00 candle closed below again at 3993.0. By the bias rule that is a two-sided day with no trade from P, but the fade still qualifies because it starts at R1 and takes its direction from the rejection close, not from the side of P.
Marker 2, the test (2026.10.26 20:00). Price pushed to 4029.83, just above R1, and the candle closed back below the level at 4020.42. That close is the rejection signal described above.
- Entry trigger: sell when the 20:00 candle closes at 4020.42.
- Stop loss: above the test high, plus the spread. The spread on this symbol was 40 points (0.40) when it was read on a demo account, so the stop goes at 4029.83 + 0.40 = 4030.23. The risk is 4030.23 − 4020.42 = 9.81 in price.
- Exit: the first target is the central pivot P. Using the same high, low and close, P = (4034.28 + 3975.61 + 3997.08) ÷ 3 = 4002.32. That is 18.10 below the entry, about 1.8 times the 9.81 risk, so the trade passes the 1.5 check from the targets section. Add a safety exit: close the trade if any candle closes back above R1.
Marker 3, the follow-through (2026.10.27 02:00). In the next 10 candles, none closed above R1, so the safety exit never triggered. The lowest close was 4005.55 at 2026.10.27 02:00. That is 23.49 below R1 and 14.87 below the entry. The lowest-low figure covers a shorter window, only the candles up to 2026.10.27 04:00: in that stretch the lowest low was 4003.72, still 1.40 above P at 4002.32, so a strict P target had not filled yet. A fixed target is a plan, not a promise. Decide before you enter whether you will trail the stop or keep waiting.
The ladder below puts the whole trade on one scale.
Next, size the position. Take an illustrative $10,000 account that risks 1%, which is $100. On this symbol one pip is 0.01, worth $1 per 1 lot. The 9.81 risk is 981 pips, so 1 lot would risk $981. $100 ÷ $981 ≈ 0.10 lots. At 0.10 lots, the move down to the lowest close (14.87, or 1,487 pips) was worth $148.70 on paper.
When pivot points fail and when to skip them
- Trend and news days. Price can slice through R1, R2 and even R3 without pausing. Fading every level on a day like that stacks up losses. If the first hours already closed strongly through R1 or S1, stop looking for reversals at the next level.
- The wrong previous day. Levels depend on the day-close time. Two platforms on different server times draw different lines. Know which close your levels use and stick with it.
- Short Sunday sessions. Some price feeds have a few hours of Sunday trading. Monday's levels are then built from that thin session instead of Friday's. In the gold example the feed had no Sunday candle, so Monday's levels came from Friday's full session.
- Levels squeezed together. On quiet days R1 and S1 can sit close to P. If the gap between two levels is only a few times the spread, trading costs eat the move.
- Too many lines. With P, three resistances, three supports and mid-points, price is almost always near some level. That makes it easy to talk yourself into any trade.
| Pros | Cons |
|---|---|
| Levels are known before the session opens | Fixed levels ignore what happens during the day |
| One formula for everyone, nothing to curve-fit | Different day-close times give different lines |
| Entry, stop and target from one tool | Weak on strong trend and news days |
| Works on any market with a high, low and close | Tight levels on quiet days leave little room after costs |
Choosing pivot point settings for your trading style
| Trading style | Chart you trade | Pivot period | Levels to watch |
|---|---|---|---|
| Scalper | 1-minute to 5-minute | Daily | P, R1, S1 |
| Day trader | 15-minute to 1-hour | Daily | P through R2 and S2 |
| Swing trader | 4-hour to daily | Weekly | P through R3 and S3 |
| Position trader | Daily to weekly | Monthly | P, R1, S1 |
When a daily level lands close to a weekly one, give that spot more weight. Two traders on different timeframes are watching the same price there.
Gold vs major FX pairs: on gold the levels sit many dollars apart, so a stop beyond a level is large in money. Cut your lot size rather than tightening the stop. On major FX pairs the levels sit closer together, so check that the next level is still several spreads away.
Before you trade pivot points
- Confirm which day-close time your levels use.
- For trades from P, note which side of P price is holding. For an R1 or S1 fade, let the rejection close set the direction.
- Wait for a candle to close at the level. A wick is not enough.
- Put the stop beyond the level, plus the spread.
- Check that the next level is at least 1.5 times your stop distance away.
- Skip fades on news days and strong trend days.
Not to be confused with a swing pivot: a candle high or low with lower highs (or higher lows) on each side. A swing pivot marks a turn in market structure, not a level calculated from yesterday's prices.
FAQ
Do pivot points work for stocks?
Yes. The formula is the same. Use the regular session's high, low and close. Adding pre-market or after-hours prices changes the levels, so pick one version and stay consistent.
Which pivot formula should a beginner start with?
The classic (floor) formula. It is the one behind every example on this page, and you can check its levels by hand with the steps above. Try Fibonacci, Woodie or Camarilla only once you know how price behaves around the classic lines, and don't mix formulas on one chart.
Do pivot points change during the day?
No. Daily levels stay put from the day's open to the next day's open. If your lines jump at an odd hour, your platform starts the new day at a different close time than you expect. Check the time of the first candle of the new day and set the day-close time to the one your levels are meant to use.