









Horizontal level
Also called Horizontal support and resistance, Price level, Horizontal line, Flat level
A horizontal level is a price where the market has turned more than once, drawn as a flat line across the chart. Traders use it to plan entries, stop losses and targets.
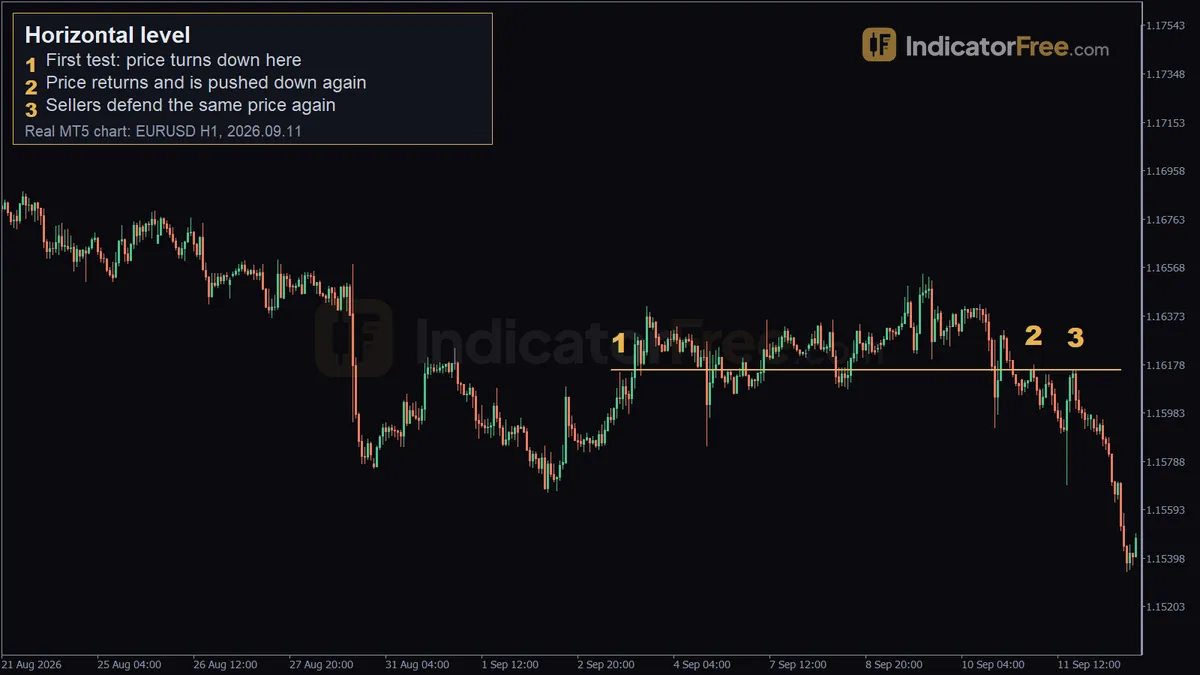
Many traders place their orders near the same few prices. If you know where those prices are, you stop buying just under a price where sellers have already pushed the market down. You can also put your stop where a turn is clearly proven wrong, not at a random distance.
A level below the current price, where buyers have pushed price up, is the bullish version, called support. A level above the price, where sellers have pushed it down, is the bearish version, called resistance.
How to find a horizontal level: a 6-point checklist
- Start on a higher timeframe. Look at the 4-hour or daily chart first, then refine on the timeframe you trade.
- Find at least two clear turns at about the same price. One turn is just a high or a low. Two turns make a level, and three make it stronger.
- Check that price really left between touches. Price must move away and come back. Five candles bunched against the same price count as one touch.
- Draw it as a band, not a single line. Put one edge where the candle bodies stop and the other edge where the wicks reach. Treat everything between the two edges as one area.
- Look for a sharp reaction. Long wicks or a fast move away show that orders were waiting there. A slow drift away tells you very little.
- Keep only nearby levels. Delete levels far from the current price. A chart covered in lines gives you an excuse for any trade. Draw your levels before the session opens, not while a candle is moving. Lines drawn in the moment tend to fit the trade you already want.
When a horizontal level is weak or broken
A level is weak when it has only one touch, when the reactions were small, or when price keeps hitting it in quick succession. Each test can use up the orders waiting there, so a level hit three times in a few hours often gives way.
Take extra care when a strong trend runs into the level with large candles, just before major news, and in choppy areas where price has crossed the line many times both ways. If price stalls under the level with small candles, a breakout is often closer than a rejection, because sellers are no longer pushing price away, and buyers keep absorbing their orders.
A level is broken when a candle on your timeframe closes clearly beyond the band and the next candles stay there. A wick that pokes through and closes back inside is not a break. It is often the clearest sign the level still holds. These wicks are common because many traders put their stops in the same place just beyond a level.
The common misread is to draw a single exact line and call it broken when price trades two pips beyond it. Placing a level is also subjective, so two traders will draw slightly different lines. To avoid this, judge by the closing price and the whole band, not by one tick. Once a level really breaks, it often switches roles. The support and resistance flip entry covers that.
The illustrative chart below shows both cases against a resistance band. First a wick spikes above the band but the candle closes back inside it. Later a candle closes above the band, and the candles after it stay above.
Reading the EURUSD example: three turns near 1.16154
The chart at the top of the page is a past EURUSD 1-hour example, not a prediction. Price turned down near 1.16154 three times between 2026.09.03 10:00 and 2026.09.11 18:00.
- Marker 1 (2026.09.03 10:00, 1.16147): the first turn down. At this point it is only a swing high. Nobody could know yet that it would become a level.
- Marker 2 (2026.09.11 04:00, 1.16175): about eight days later, price came back and sellers pushed it down again. Two turns now justify drawing the level. Note that this high sits above the first one.
- Marker 3 (2026.09.11 18:00, 1.16154): fourteen hours later, sellers defended the same area a third time.
Now measure the band: 1.16175 − 1.16147 = 0.00028, which is 2.8 pips. The level is really the area from about 1.1615 to 1.1618. If you had drawn a single line at 1.16147, marker 2's high at 1.16175 would have looked like a break. Judged as a band, it was just a test.
Note also that markers 2 and 3 came on the same day. Two tests that close together mean a fourth test soon after deserves less trust than the first three.
Trading a horizontal level: entry, stop and target
Both setups below use the real band from the EURUSD example, 1.16147 to 1.16175. The stop and target distances in pips are an illustrative example, not prices from the chart. In both, the stop sits 20 pips above 1.16147, which leaves about 17 pips of room above the top of the band at 1.16175. The target is the nearest swing low below the band, 55 pips under 1.16147.
Setup 1: selling after the rejection candle closes
- Entry: sell at the close of the candle that rejects the third test at 1.16154. In this illustrative example, say it closes 17 pips below the bottom of the band at 1.16147.
- Stop loss: 20 pips above 1.16147, clear of the highest wick of the band at 1.16175.
- Target: the swing low, 55 pips under 1.16147.
Risk is 17 + 20 = 37 pips, and reward is 55 − 17 = 38 pips. That is about 1:1. By the rule below, you would skip this entry or wait for a better price. You waited for confirmation, so the move had already started before you got in.
Setup 2: a sell limit at the bottom of the band
- Entry: sell limit at 1.16147, the bottom of the band, placed before the third test reaches it.
- Stop loss: the same, 20 pips above 1.16147.
- Target: the same swing low, 55 pips under 1.16147.
Risk is now 20 pips and reward is 55 pips, so you could earn more than 2.5 times what you risk. The trade-off is that you have no confirmation. A clean break would hit your stop with no warning. Use this rule: if the reward is less than 1.5 times the risk, either improve the entry or skip the trade.
Here is how to size Setup 2 on a $10,000 account risking 1%, using the standard $10 per pip for one standard lot (100,000 units) on a USD-quoted pair:
FAQ
Should I draw horizontal levels on wicks or on candle bodies?
Use both. Draw the band from where the bodies stop to where the wicks reach. The wick edge tells you where to put the stop. The body edge tells you where most of the trading happened.
Do horizontal levels work the same on gold or indices as on forex?
The logic is the same: price turns where orders gather. What changes is the width of the band. Measure it in that market's own price units and size it to how far that market normally moves, not in forex pips. Indices can also gap at the open, so price may jump straight past a level without testing it.
How long does a horizontal level stay useful?
It stays useful until it clearly breaks or gets tested many times in a row. Daily-chart levels can matter for months. Levels from a 1-minute or 5-minute chart often stop mattering within the same session.