









Swing high
Also called Swing top, Pivot high, Fractal high
A swing high is a candle whose high is above the highs of the candles on both sides of it. It marks a peak where buyers stopped pushing and price turned lower, at least for a while.
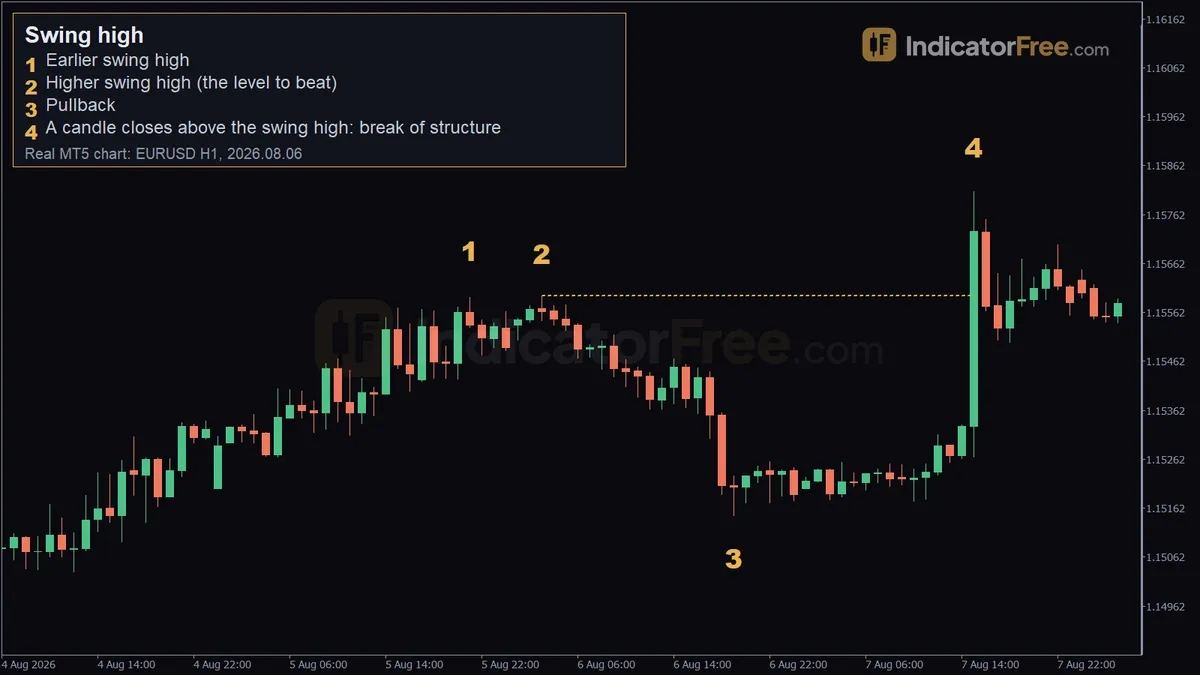
Most of your stop losses, breakout entries and trend calls depend on a swing high. If you mark the wrong one, your stop sits in the wrong place, or you buy a "breakout" of a level the market never cared about.
How to mark a swing high: a 5-step checklist
- Find a candle whose high stands above the candles around it.
- Check the left side. At least two candles before it should have lower highs.
- Check the right side. At least two closed candles after it should have lower highs. Until they close, the peak is only a candidate.
- Mark the level at the wick high, not the body. That is the price the market actually reached.
- Make sure a real pullback followed. Price should move clearly away from the high, by more than a typical candle, before you treat it as part of the trend.
Two candles on each side is a common convention, not a fixed rule. Use more candles and you get fewer, stronger highs. Use fewer and you get more highs, and more of them are noise.
The chart below shows the rule in action. The marked peak has two lower highs on each side. It only counts once the second lower high on the right has closed. Later, a close above the level breaks it.
Higher highs and lower highs: the bullish and bearish read
The main reason to mark swing highs is to read the trend. Compare each new swing high with the one before it.
Bullish version: each new swing high is above the last one (a higher high), with higher lows in between. That is an uptrend.
Bearish version: each swing high is below the last one (a lower high). Sellers are stepping in earlier each time, which is the mark of a downtrend.
Use this decision rule. If the last swing high is lower than the one before, stop taking breakout buys. A close above that lower high is your first warning that the downtrend may be ending. Buy again only after the next pullback holds above the previous swing low.
A common misread is to call an uptrend after one higher high that follows a series of lower highs. One higher high only shows that buyers pushed once. The uptrend starts when the next pullback holds above the previous swing low and forms a higher low. Until then, treat the move as a possible bounce inside the downtrend.
Higher high, lower low and swing low each have their own glossary entries.
Strong, weak and broken swing highs
A strong swing high shows clear rejection (a long upper wick or a sharp drop), followed by a deep pullback. Highs that are also visible on a higher timeframe carry more weight, because more traders are watching them.
A weak swing high has a shallow pullback, forms in the middle of a tight range, or comes from one spike during a news release. Treat it as a minor level, not a ceiling.
A swing high is broken when a candle closes above it. A wick that pokes above the level and then closes back below it is not a break. It is usually a liquidity sweep: price grabs the buy stops above the high and then reverses.
The most common misread is buying the instant price ticks above the high. Before you act, wait for the candle to close. The close tells you whether the level was broken or swept.
Reading the EURUSD 1-hour example, marker by marker
The four marked points below come from a past EURUSD 1-hour chart, not a prediction. The levels chart after the list shows them side by side.
- Marker 1 is the earlier swing high, on 5 Aug 2026 at 21:00, at 1.15594.
- Marker 2 is the higher swing high, on 6 Aug 2026 at 03:00, at 1.15597. It is only 0.3 pip above marker 1. In practice the two form a pair of near-equal highs, and stops from traders who sold there tend to sit just above them. The level to beat is the higher one, 1.15597.
- Marker 3 is the pullback low, on 6 Aug 2026 at 19:00, at 1.15147. That is 45 pips below the high (1.15597 − 1.15147 = 0.00450). A pullback this deep is what makes marker 2 a real swing high and not just a pause.
- Marker 4 is the 7 Aug 2026 15:00 candle. It closed at 1.15728, which is 13.1 pips above 1.15597. That close is the break of structure. The marker label on the chart at the top reads 1.15809, which is not the close. In this lesson, marker 4 has one price: the close, 1.15728, because the break is judged on the close.
After the break, the 1.15147 pullback low became the swing low that protects the new up-move. If price falls back below it, the bullish read is gone.
Trading setups built on a swing high
Use one decision rule. If a candle closes above the swing high, look at the break setup. If price wicks above it but closes back below, look at the rejection setup. If neither happens, wait.
Buying the close above a swing high
The figures below are an illustrative example built on the real prices from the chart above. You enter at the close of the breaking candle, 1.15728. Your stop goes at the pullback low, 1.15147. To keep the maths simple, this example uses no buffer. In live trading you would add a small buffer below the low. That makes the stop wider, so work out the size again using the wider distance. Your target is twice the risk. Say your account is $6,000 and you risk no more than 1%. On EURUSD, a standard lot of 100,000 units is worth $10 per pip.
This shows the method only. The chart does not tell you whether that target was reached. If you want a tighter stop, a common alternative is to wait for price to dip back toward 1.15597 and hold above it, then enter there.
Selling a rejection at a swing high
In a range or a downtrend, price often comes back to an earlier swing high and fails there. Your trigger is a candle that wicks above the high and then closes back below it. Enter on that close. Place your stop a few pips above the new wick high. Target the most recent swing low. Skip this trade if the higher timeframe is trending up strongly.
Quick check before either trade: two closed lower highs on each side, a real pullback, a candle close (not a wick) deciding break or rejection, and a stop beyond the opposite swing with your size worked out from that distance.
When swing highs work and when to skip them
Swing highs are most useful in clean trends, on the 1-hour chart and above, and during active trading sessions. In those conditions a high is more likely to reflect real selling than random noise. For day trading, mark them on the 1-hour or 4-hour chart and drop to the 5-minute or 15-minute chart only to time your entry.
Skip them in tight sideways markets, where a new "high" prints every few candles. Also skip them in the minutes around high-impact news, and on 1-minute charts, where most peaks are just noise.
Keep only the last two or three swing highs on your chart. Old, already-broken levels add clutter.
| Pros | Cons | |
|---|---|---|
| Stop placement | Gives a logical spot for your stop, beyond the level | Obvious levels attract stop hunts |
| Trend reading | Comparing highs shows the trend direction at a glance | You only know it is a swing high two candles after the peak |
| Entries | Clear break and rejection triggers | False breaks are common in ranges |
| Markets and timeframes | Works on any pair or index, on the 1-hour chart and above | The number of candles per side changes the result |
FAQ
What if two candles in a row have the same high?
Treat the pair as one swing high at that price. Then apply the lower-high check to the candles on either side of the pair.
How long does a swing high stay relevant?
Until a candle closes above it. An unbroken high from weeks ago on the daily chart can still stop price. A small 1-hour high usually stops mattering once price has moved well away from it.