









Market structure
Also called Price structure, Swing structure, Trend structure, MS
Market structure is the pattern of swing highs and swing lows price leaves on a chart. Higher highs and higher lows mark an uptrend, lower highs and lower lows mark a downtrend, and a break of that pattern warns the trend may be changing.
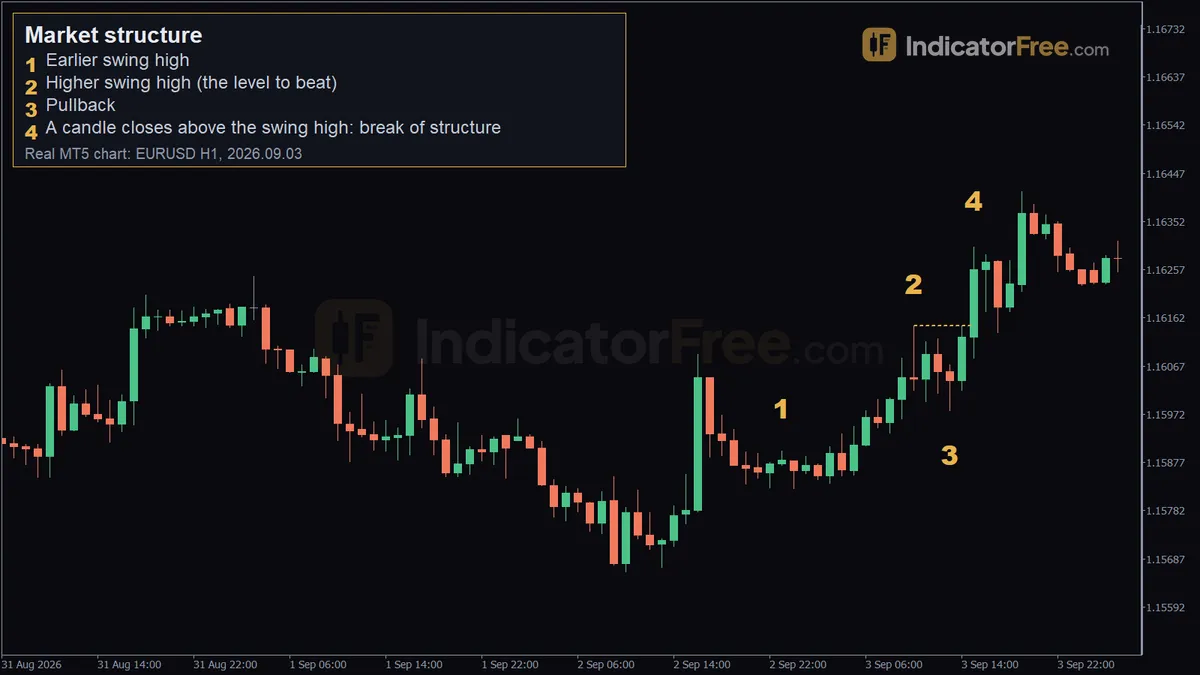
Market structure tells you which side of the market you should be on and where a stop loss makes sense. Read it wrong and you end up buying a market that is making lower lows, with your stop sitting where the next drop will take it out.
How to identify market structure on any chart
A swing high is a peak with lower highs on both sides of it. A swing low is a trough with higher lows on both sides. Market structure is just the order in which these swings appear. The method is the same in forex, crypto, stocks and on any timeframe, from the 1-minute chart to the daily.
- Choose one timeframe and stick to it while you mark it up (for example, the 1-hour chart).
- Mark the clear swing highs and swing lows. Skip tiny wiggles that are only a candle or two deep.
- Compare each swing high with the one before it, and do the same for each swing low.
- Higher highs plus higher lows = bullish structure. Lower highs plus lower lows = bearish structure. A mix, with price stuck between two levels, = range.
- Find the level to beat: in an uptrend, the latest swing high. In a downtrend, the latest swing low.
- Wait for a candle to close beyond that level: in an uptrend, a close above the latest swing high; in a downtrend, a close below the latest swing low. That close is a break of structure (BOS): the trend has continued.
- Mark the protected low (the last higher low in an uptrend) or the protected high (the last lower high in a downtrend). A close beyond it is a market structure shift (MSS), also called a change of character (CHoCH): the first warning the trend may be turning.
The chart below shows both events: a break of structure while the uptrend is still healthy, then a lower high and a close below the last higher low.
Reading the EURUSD 1-hour example, marker by marker
The chart at the top of this page is a past EURUSD 1-hour chart. It shows a real break of structure, not a prediction.
- Marker 1, the earlier swing high: 1.15900 on 2 September 2026 at 23:00. This is the first peak in the sequence.
- Marker 2, the higher swing high: 1.16147 on 3 September 2026 at 10:00. It sits 24.7 pips above marker 1 (1.16147 − 1.15900 = 0.00247), so the structure is bullish. This peak becomes the level to beat.
- Marker 3, the pullback: price dipped to 1.15979 at 13:00, a pullback of 16.8 pips (1.16147 − 1.15979). It held above the old 1.15900 high, so this low became the first higher low of the move.
- Marker 4, the break of structure: the marker sits at the 15:00 candle's high, 1.16302; what counts is the close, 1.16258, above 1.16147. That close is the BOS. The uptrend continued, and 1.15979 became the new protected low.
The detail worth copying: the pullback stopped above the previous swing high. When old resistance acts as a floor, the bullish structure is in good shape.
Valid structure vs weak or broken structure
A wick that pokes above a swing high and closes back below it is not a break. More often it is a stop hunt: price grabs the orders sitting above the high, then falls back.
Structure is weak when the swings barely move apart. Use a quick rule: if each new high clears the last by less than one average candle, treat it as a possible range, not a strong trend.
A common misread is marking swings on one timeframe and the break on another. A 1-hour uptrend can show a 5-minute "shift" every few hours. If you want to trade the 1-hour trend, judge breaks on the 1-hour chart.
Use two timeframes: the higher one sets direction, the lower one times entries
Mark the 4-hour or daily structure first; that is your direction. Then drop to the 1-hour chart to find the break of structure and the retest you will trade. If the 4-hour is bullish, take only 1-hour buys. A shift on the timeframe you trade ends your buys on that timeframe. If the 4-hour is still bullish, wait for the 1-hour to turn back up before buying again.
Trading setups built on market structure
Setup 1: buy the retest after a break of structure
The idea is to wait for price to come back to the broken high, then buy with the stop under the protected low. The plan below is an illustrative example that uses the levels from the EURUSD chart above. It is not a record of a real trade.
- Entry: a buy limit at the broken swing high, 1.16147.
- Stop loss: a few pips under the 1.15979 pullback low. Entry to the pullback low is 16.8 pips. Add a buffer of 3.2 pips, picked so the stop comes to a round 20 pips of risk.
- Target: twice the risk, 40 pips above entry.
The position size follows from the stop, not the other way round. With a $10,000 account risking 1%, the maths looks like this. One standard lot (100,000 units) on a USD-quoted pair moves $10 per pip.
If price never comes back to the broken high, you miss the trade. That is fine: chasing a candle far above the level makes your stop wider and your size smaller.
Setup 2: stop buying after a market structure shift
When a candle closes below the protected low, close or tighten any buys still open and stop taking new ones. Then wait. If price forms a lower high and breaks the next swing low, bearish structure has started. Now you mirror Setup 1: sell the retest of the broken low, with the stop above the lower high. Target twice the distance from entry to stop, and size the trade the same way.
When market structure works and when to skip it
It works best in clean trends, where swings are easy to see and pullbacks are orderly. It also helps right after a range breaks, when a fresh sequence of highs and lows starts.
Skip it in tight ranges, where every swing "breaks" the last one by a pip and then reverses. Also be careful around major news, when one candle can close through several levels at once and then reverse.
| Pros | Cons | |
|---|---|---|
| Clarity | Works on any market and timeframe with nothing but price | Swing choice is subjective: two traders can mark different highs |
| Risk | Gives a logical stop level (the protected low or high) | Stops can be wide after large swings |
| Timing | A single candle confirms each break, so the signal is clear | Waiting for the close means a later, worse entry |
| Conditions | Clear in trending markets | Gives constant false signals in ranges |
Market structure checklist before you place a trade
- Are the last two highs and the last two lows both rising (or both falling)?
- Did a candle close beyond the level, or only wick through it?
- Where is the protected swing, and does my stop sit beyond it?
- Did I mark the 4-hour or daily structure first, and am I trading only in that direction on the 1-hour chart?
- After the latest BOS, did I redraw the protected swing (the old one no longer matters once a new higher low forms) and trail any open stop to it?
FAQ
What if the 1-hour and 4-hour structure disagree?
Follow the two-timeframe rule above: no 1-hour buys until the 1-hour turns back up. If the 4-hour itself then closes below its own protected low, the direction has flipped, and you look for 1-hour sells instead.
How many swings do I need before I call it a trend?
You need at least two swing highs and two swing lows to compare. One higher high on its own is just a move. A higher high followed by a higher low is the first sign, and a close above the next high confirms it.
Does market structure work the same in crypto and stocks?
Yes. Swing highs and lows are read the same way on any chart. Stocks have gaps at the open, so a break can happen overnight. Treat a gap that closes beyond the level as a break, and expect wider stops.