









Higher high
Also called HH, Higher swing high
A higher high is a swing high that peaks above the previous swing high. When higher highs and higher lows form in sequence, the market is in an uptrend.
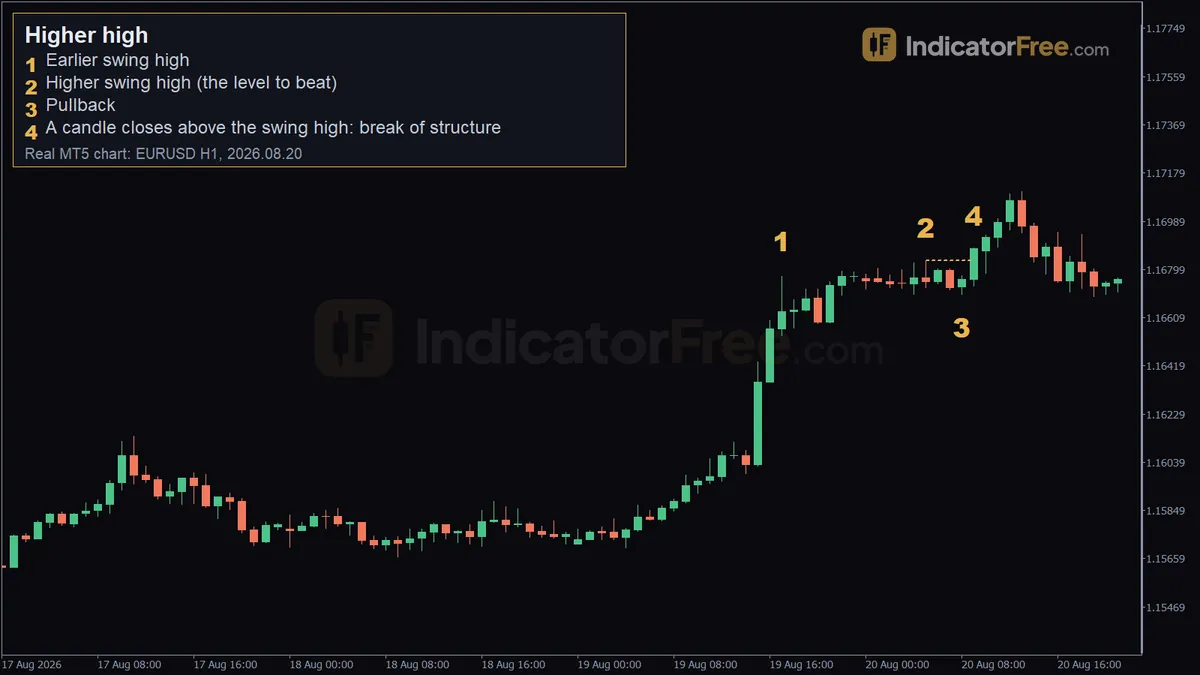
Every new higher high shows that buyers paid more than they did at the last peak. If you read it correctly, you trade with the trend. If you mistake a wick or a news spike for one, you can end up buying at the exact top that sellers are defending.
Four rules to confirm a higher high
- Find the last confirmed swing high. This is a peak with lower highs on both sides of it.
- Look for a turn on both sides of the new peak. Price has to drop away from the old peak before it rises again, and it has to turn down from the new peak afterwards. Without the first pullback you only have one swing still stretching higher. Until the second turn, the new peak is a running high that can still extend.
- Price must clear the old peak, and a candle must close above it. If price only ties or nearly ties the old peak, you have equal highs, not a higher high. A wick above makes a higher high on paper, but treat it as unconfirmed until a candle closes above. Judge the close on the timeframe you marked the level on.
- Stick to one timeframe. A higher high on the 5-minute chart can sit inside a falling daily chart. Label each timeframe separately.
Strong, weak and broken higher highs
A strong higher high comes from a candle that closes clearly beyond the old peak, made by wide candles with small upper wicks. The pullback that follows holds above the last higher low.
A weak higher high only just clears the old peak, comes from a single news spike, or closes back under the level within a candle or two. Many of these are liquidity sweeps. Price runs the stop orders resting above the old high and then reverses.
A higher high is broken once price closes below the higher low that launched it. At that point the uptrend sequence has failed, however good the high looked.
A common misread is when a long upper wick on the 1-hour chart looks like a clean breakout on the 5-minute chart. Before you count it, check the close on the timeframe where you drew the level.
Reading higher highs together with the lows
The trend comes from comparing each swing with the one before it. A higher low is a swing low that bottoms above the previous swing low.
| Sequence | What it says | Usual stance |
|---|---|---|
| Higher high + higher low | Buyers push further and defend higher | Look for buys |
| Higher high + lower low | Swings widen both ways, no side in control | Stand aside or trade smaller |
| Lower high + higher low | Range is squeezing | Wait for a break |
| Lower high + lower low | Sellers in control | Look for sells |
The chart below shows the healthy version. Each peak clears the last one, and each dip stops above the last dip.
The EURUSD 1-hour example, marker by marker
The chart at the top of the page is a past EURUSD 1-hour example, not a prediction.
- Marker 1 is the earlier swing high: 1.16772 on 19 August 2026 at 17:00.
- Marker 2 is the higher swing high: 1.16835 on 20 August 2026 at 05:00. It sits 6.3 pips above marker 1 (1.16835 − 1.16772 = 0.00063), which makes it a higher high and the new level to beat.
- Marker 3 is the pullback to 1.16701 at 08:00, 13.4 pips below the peak. The dip also fell under marker 1, so the old high did not hold as a floor.
- Marker 4 is the 09:00 candle, which closed at 1.16880, 4.5 pips above 1.16835. A body close above the latest higher high is a break of structure. The new peak only counts as a confirmed higher high once price turns down and leaves it behind.
Judged against the strong and weak rules above, this was not a textbook strong break: the pullback fell under marker 1, and the break was a single close of 4.5 pips.
Trading the break above a higher high
Setup: buying the close above 1.16835 on EURUSD 1-hour
The numbers below are an illustrative example that uses the chart's real prices.
- Entry: 1.16880, at the close of the 09:00 candle that broke the higher high.
- Stop loss: at 1.16701, the pullback low (in practice a pip or two below). If price drops below it, the structure behind the trade is gone.
- Target: twice the risk, which is 35.8 pips above the entry.
With 0.10 lot (10,000 units, about $1 per pip on EURUSD), a full stop-out costs $17.90 and the target pays $35.80. The chart facts do not show what happened next, so plan for both outcomes before you enter.
A decision rule: if the breakout candle is much bigger than the candles before it, don't chase it. Wait for price to come back toward 1.16835 and buy there. Keep the stop under 1.16701. This gives you a shorter stop and a better reward-to-risk on the same idea.
When higher highs work and when to step aside
Higher-high breaks tend to behave best when the higher timeframe is also rising, swings are clean and evenly spaced, and the market is in an active session.
Step aside before high-impact news, inside tight ranges where peaks sit almost level, and when a higher-timeframe resistance level sits just above. In those conditions the new high is often the sweep rather than the start of the next leg.
| Pros | Cons |
|---|---|
| Clear, rule-based way to read trend direction | Confirmation comes late, after part of the move |
| Gives a logical stop under the higher low | Wicks and spikes create false breaks |
| Works on any market and timeframe | Different timeframes can disagree |
| Pairs with higher lows for a full trend read | Choppy markets print many meaningless highs |
Bullish and bearish readings of a higher high
In an uptrend, a higher high with a higher low still holding is a bullish sign that the trend is continuing.
In a downtrend, the first higher high after a run of lower highs is an early warning that sellers are losing control. Structure traders call this a change of character. A higher high in price that an oscillator does not confirm is bearish divergence.
Practical tips for trading higher highs
- Count the gap between peaks. Very small gains on each new high show momentum fading.
- Don't buy every higher high. Pick the first break after a clean pullback, not the fourth push of an extended run.
Quick checklist before you act
- Old swing high marked at its wick high and confirmed, then a pullback.
- A candle body closed above it on your timeframe.
- The higher low below is intact and your stop sits under it, not under the broken high.
- The next timeframe up is rising, or you trade smaller.
- No major news due and no higher-timeframe resistance just overhead.
FAQ
How many higher highs do I need before calling an uptrend?
At least two rising swing highs with a higher low between them. Many traders wait for a second higher high and higher low pair before they trust the trend.
Can an indicator mark higher highs for me?
Yes. Swing-point indicators label highs and lows using a lookback setting. A label can only appear a few candles after the peak, because the tool needs bars on the right to confirm it. Check whether labels move or disappear later.
Should I move my stop up after each new higher low?
You can, and many trend traders do. Once a new higher low is confirmed, the stop moves just under it. This protects part of the move, but a deeper pullback will stop you out sooner.