









News spike
Also called news candle, news release spike, news-driven spike, news volatility spike
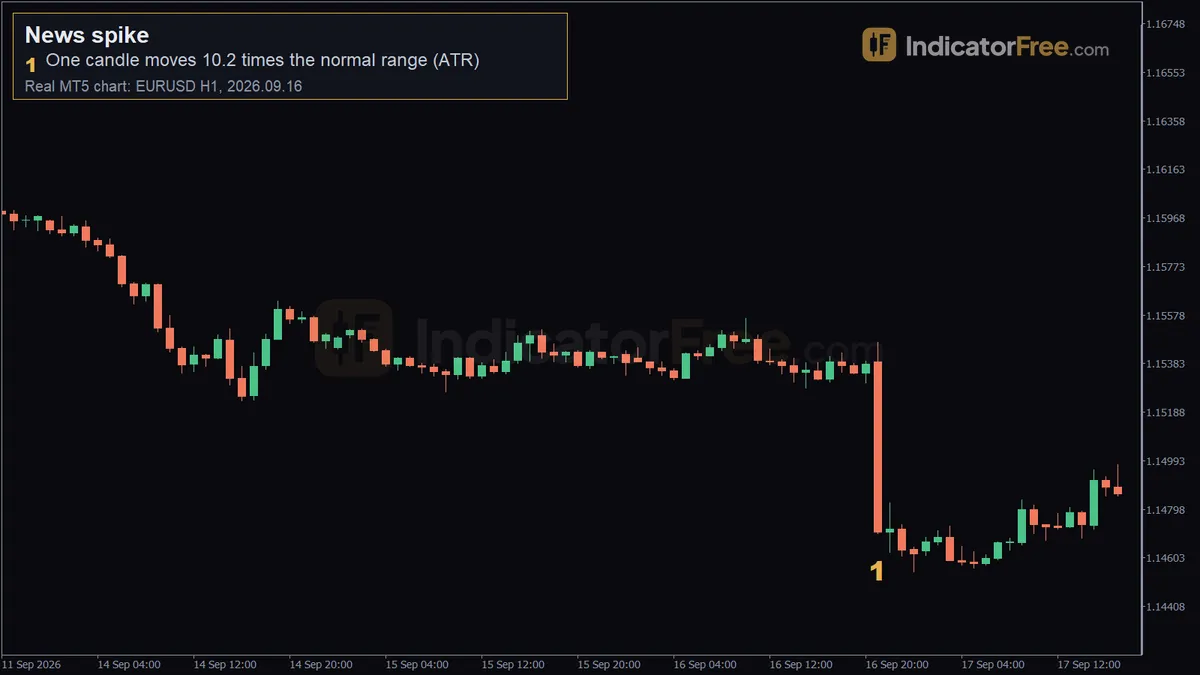
A news spike is a sudden, oversized price move right after a scheduled economic release, such as a central bank rate decision. It often prints one candle many times larger than the candles before it.
Direction is not the main risk. Size is. A stop that is safe in a normal hour can be jumped in seconds, and the spread is often at its widest just as your order fills. If you can read a news spike correctly, you know whether to follow it, wait for it to fail, or stay out.
How do you spot a news spike? A 5-point checklist
- A scheduled release falls in that candle. Check the economic calendar for a rate decision, jobs report or inflation figure at that time. If there was no event, it is an ordinary spike, not a news spike.
- The candle is at least 3 times the ATR before it. ATR (Average True Range) is the average size of recent candles. 14 periods is the usual setting. Divide the candle's high-to-low range by the ATR of the candle before it. Use 3 as your working threshold.
- It leaves the pre-news range in one candle. The pre-news range is the high and low of the quiet hours before the release. A news spike jumps out of that range. It does not drift out.
- Most of the candle is body. One side overwhelmed the other, so the open and close sit far apart.
- A first poke the other way is common. The candle often wicks against its final direction before it runs. Do not read that wick as the trend.
The FOMC spike on EURUSD, 16 September 2026, marker by marker
The chart at the top of the page is a past example, not a prediction. It shows EURUSD 1-hour candles around the US Federal Reserve (FOMC) rate decision. The decision landed in the 21:00 server-time candle.
Before the release. From 14:00 to 20:00, price stayed between 1.15284 and 1.15425. That is a pre-news range of about 14 pips. The 20:00 candle closed at 1.15381. That close is the pre-news price.
Marker 1 (21:00, 1.14701). The candle opened at 1.15391 and poked up to 1.15468. Then it fell to 1.14701 and closed at 1.14705, just 0.4 pips above its low.
How big it was. The range was 1.15468 − 1.14701 = 76.7 pips (77 rounded). The 14-period ATR before it was about 7.5 pips (8 when rounded). 76.7 ÷ 7.5 ≈ 10.2, so the candle was 10.2 times the normal range.
After it. The next candle bounced only to 1.14823. The lowest point came at 00:00, at 1.14548. By 09:00 the next day the high was 1.14835, still about 45 pips below the pre-news range.
The bars below compare that candle with the normal EURUSD hourly ranges the Lab measured from 2025-10-30 to 2026-10-30 (past data, not a forecast). The spike came in late New York hours, when the average 1-hour range was 10.3 pips. The spike was more than seven times that. It was also over four times the 17.8-pip average of the busiest window, the London/New York overlap.
Strong, weak and broken news spikes: read the close
You judge a spike with two levels, and this page uses the same two everywhere. The first is the pre-news range (or the pre-news price) defined above. The second is the spike midpoint: the price halfway between the spike candle's high and low.
Strong. The candle closes in the outer third of its range, beyond the pre-news range. In the FOMC example, 76.7 ÷ 3 ≈ 25.6 pips. So the outer third is the bottom 25.6 pips of the candle, measured up from the low at 1.14701. The close at 1.14705 sits inside it, so the spike is strong.
Weak. Long wicks on both sides and a close near the spike midpoint. The market reacted hard, then could not decide which way to go.
Broken. The close is back inside the pre-news range, either on the spike candle or within the next few candles. The first reaction was rejected.
A common misread is to call a broken spike strong because its range was huge. Size only tells you news hit. The close tells you who won. The drawing below shows all three cases.
How to trade a news spike after the candle closes
Do not enter while the spike candle is still forming. Prices jump, the spread is wide, and the candle can still turn into a broken spike. Both setups below wait for the close and use only the two levels defined above.
Setup 1: sell the failed pullback after a strong spike
The rule: the spike must be strong. Then wait for the first pullback candle. If the pullback stays below the spike midpoint and closes back near its open, enter at the next candle's open. Put the stop a small buffer above the pullback high. Take profit at 1:1 (the same distance as your stop).
With the FOMC example's real prices:
- Spike midpoint: the price halfway between the high of 1.15468 and the low of 1.14701.
- Pullback: the 22:00 candle reached only 1.14823, well short of the midpoint. It closed at 1.14719.
- Entry: sell at the 23:00 open, 1.14718.
- Stop loss: 2.5 pips above the pullback high of 1.14823. Risk = 13.0 pips.
- Target: 13.0 pips below the entry. The 00:00 candle's low of 1.14548 reached it.
The chart below marks the entry and the pullback high on the real candles. Notice how small the follow-through was. Price never went more than 15.7 pips past the spike close. Most of the move happened inside the spike candle, which is why a 1:1 target makes more sense here than a large one.
When you size this trade, allow for slippage, because a stop placed near news can fill worse than its price. The figures in this sizing example are illustrative: a $10,000 account, 1% risk, and a 7-pip slippage buffer added to the 13-pip stop. On EURUSD, one standard lot is worth $10 per pip.
If you skip the buffer and size for 13 pips, you get $100 ÷ 130 ≈ 0.77 lots. Then if the stop slips 7 pips, you lose 0.77 × 20 × $10 = $154 instead of $100.
Setup 2: fade a broken spike back to the pre-news price
The rule for a bearish spike: buy only after a candle closes back above the spike midpoint. Enter at the next open. Put the stop just below the lowest low since the release. Target the pre-news price.
In the FOMC example, the trigger is a close above the spike midpoint. The stop goes below 1.14548 and the target is 1.15381. The trigger never fired, because the highest price by 09:00 the next day was 1.14835. That is the decision rule doing its job: if price does not get back above the midpoint, you do not fade.
When news spikes fail and when to stay out
A spike fails when new information changes the first reading. A central bank decision is often followed by a press conference that can reverse the first move. A data figure can be revised. A second release can land an hour later. Thin markets make all of this worse.
Costs change too. On a demo account read at a quiet moment (26 October 2026), the EURUSD spread was 1 point, which is 0.1 pip. Around a release it can be many times wider, and stops can fill beyond their price.
Two rules of thumb. If the spike candle closes weak, do nothing. If another release is due within the next two hours, do nothing.
| Pros | Cons |
|---|---|
| Scheduled: you know when it will come | Spread widens and stops can slip |
| Clear levels: midpoint, pre-news range, extreme | Follow-through after the candle is often small |
| A strong close shows which side won | A second event can reverse the move |
| Weak or broken closes tell you to stand aside | Wider stops force a smaller position size |
Bullish and bearish news spikes
A bullish news spike is the mirror image: the candle closes in the upper third, above the pre-news range. Trade it like a momentum breakout. If it falls back into the range, treat it as a false breakout.
A bearish news spike is the FOMC case above. If price later climbs back to test the pre-news range low from below, that is a breakout retest.
Before you trade a news spike
- Release time checked, and no second event within two hours
- Spike candle closed, not still forming
- Range at least 3 times the ATR before it
- Close in the outer third, outside the pre-news range
- Spike midpoint and pre-news price marked on the chart
- Position sized with a slippage buffer on the stop
FAQ
What counts as high-impact news in forex?
Releases that change what traders expect from interest rates. The main ones are central bank decisions, employment reports, inflation figures and GDP. Economic calendars flag them as the top impact level.
Should I hold an open trade through a news release?
Check where your stop is. If it is closer than about 3 times the current ATR, it sits inside a normal news spike's reach. Either close the trade before the release or cut your size so that a slipped stop is still a loss you can accept.
Do news spikes happen on gold too?
Yes, and the same tests apply. From 2025-10-30 to 2026-10-30, the XAUUSD 1-hour ATR(14) averaged $21.4 (past data, not a forecast). Using the 3-times rule, a gold candle larger than about $64 around a release fits the definition.