









False breakout
Also called Fakeout, Fake breakout, Failed breakout
A false breakout is when price closes beyond a support, resistance or range edge, can't stay there, and closes back inside the range or back on the original side of the level, often followed by a move the other way.
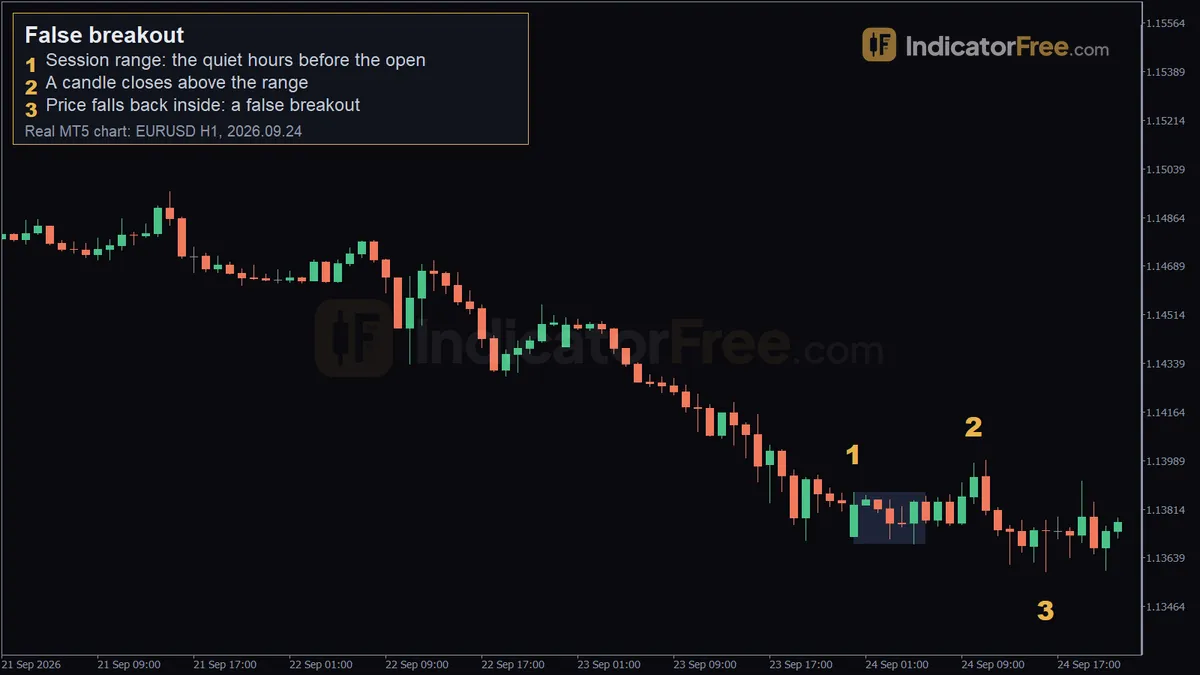
If you buy every close above resistance, a false breakout is the trade that stops you out. Read correctly, the same move can give you an entry in the other direction, with a stop loss that is easy to place.
What a breakout is, and when it turns false
A breakout is a candle that closes beyond a level the market has respected, such as a range high, a range low or a support or resistance line. Traders join the move because they expect it to keep going.
The break turns false when price can't hold outside the level and closes back inside it. The buyers who chased the break now hold losing trades. Their stop losses usually sit just under the broken level or a little inside the range. When those sell orders are hit, they push the reversal further.
Bullish and bearish false breakouts
A bearish false breakout fails at the top of a range or at resistance. Price closes above the level, the buying dries up, and price closes back below it. The failed move up becomes a reason to sell, as in the EURUSD example on this page.
A bullish false breakout is the mirror image at the bottom. Price closes below support or a range low, sellers can't push it any further, and price closes back above the level. The failed move down becomes a reason to buy.
The name tells you which way to trade, not which way the break went. A bearish false breakout is an upside break that fails, and a bullish false breakout is a downside break that fails. The bull trap, bear trap, stop hunt and liquidity sweep are related ideas with their own glossary entries.
Spotting a false breakout: a six-step checklist
- Find a clear level. Look for a range with at least two touches on each side, or a quiet session range like the hours before a major market opens.
- Wait for a close beyond it. A wick that pokes through and closes inside isn't a breakout. It's only a rejection.
- Watch the follow-through. A real break keeps going. A weak one stalls within a few candles.
- Wait for a close back inside. This is the trigger. A candle body must close back on the range side of the level.
- Mark the extreme. The highest point of a failed upside break, or the lowest point of a failed downside break, is where your stop loss goes.
- Check the room. The far side of the range should be at least as far from your entry as your stop is. If it isn't, the trade isn't worth taking.
A simple decision rule: if price closes back inside within one to three candles, treat the break as failed. If it holds outside for several closes and starts making new highs or lows, the break is probably real. Leave it alone.
Strong, weak and broken false-breakout signals
A strong signal has a short break and a decisive return. The candle that comes back inside closes well inside the range, not on the edge.
A weak signal closes back on the level itself, or barely inside it. Price is undecided. Expect it to test the edge again before choosing a side.
The signal is broken when price returns outside and closes beyond the false-breakout extreme. At that point the original breakout was real, just slow, and your stop loss should already have closed the trade.
Common misread: the retest. In a retest, price comes back to the broken level from outside, touches it and closes outside again. That supports the breakout. A false breakout needs a close inside the level. Judge the close, not the touch. The illustrative chart below shows both on the same level.
Reading the EURUSD example at the top of the page
The chart at the top of the page shows a past example on the 1-hour EURUSD chart. It isn't a forecast.
All times below are chart time, which is the broker's server time. Check your broker's time offset to match them to the trading sessions where you live.
Marker 1, the session range. On 24 September 2026, from midnight to 6:00 chart time, price stayed between 1.13689 and 1.13876. That is a quiet 19-pip box, set during the hours before the busier session opened. The marker sits on the range high at 1.13876.
Marker 2, the break. Later that morning, the candle at 10:00 closed at 1.13929, about 5 pips above the range high. A breakout trader would have bought here. The marker is at 1.1398.
Marker 3, the failure. Price fell back inside the range. The 11:00 candle closed at 1.1381, back below the range high, so the upside break had failed. Marker 3 sits at 1.1359, the low of the 16:00 candle's wick, but that candle closed at 1.13737, back inside the range. Judged by the close, price never held below the range.
The low edge produced a small failure of its own. The 14:00 candle closed at 1.13683, just under the range low, and the next candle closed straight back inside at 1.13738. That is a small bullish false breakout at the opposite edge of the same range.
What this shows: a small break of a small range, with no follow-through, is the classic setup. Anyone who bought the 10:00 close and placed a stop just under the range high was stopped out within hours.
Trading a false breakout: entry, stop loss and target
Selling the failed EURUSD break back into the range
Using the same chart:
- Entry: wait for a candle to close back below the range high of 1.13876. Here the 11:00 candle did that, closing at 1.1381. Once that close is confirmed, place a sell limit order at 1.13876. That close is already below the range high, so the order fills only if price rallies back up to the edge. If it never does, you miss the trade, and you accept that.
- Stop loss: put your stop just above the highest point of the failed break. The 10:00 candle reached 1.1398, but the 11:00 candle went higher, to 1.13991, so that is the extreme. In this example we use 1.13999, less than a pip above it.
- Target: the range low at 1.13689.
In this past example, the order didn't fill straight away. After the 11:00 close, candle highs stayed between 1.13747 and 1.1382, below the entry, so the drop to the 1.1359 wick at 16:00 happened before the trade existed. The 19:00 candle rallied to 1.13916, which filled the sell at 1.13876 without reaching the stop. The 20:00 candle then fell to 1.13654, through the target at 1.13689.
Sizing the trade so one failure costs a fixed amount
If the breakout turns out to be real, price can run against you quickly. Fix your loss in money before you enter. The figures below are an illustrative example: a $10,000 account risking 1% on EURUSD, where one standard lot (100,000 units) is worth $10 per pip, and the sell limit order is filled at the range high.
When to fade a false breakout, and when to stay out
False breakouts work best when the market is moving sideways, when the range is narrow and clearly defined, and around session opens. At those times, a short burst of orders can push price through the edge without any lasting reason behind it.
Avoid them when a strong trend is running in the direction of the break, or when major news is due. A real shift in the fundamentals can turn a small break into a lasting move. Also skip ranges that are tiny compared with normal candle size. There, a break and a return are just noise.
| Pros | Cons | |
|---|---|---|
| Reward to risk | Target is the far side of the range or beyond | Narrow ranges leave little room to the target |
| Timing | Trigger is one candle close, easy to see | A limit order back at the edge may never fill |
Practical tips for trading fakeouts
- Draw the range before the break happens. A level you draw after the move is usually a level you fitted to the chart.
- Take partial profit at the middle or the far side of the range. Ranges often stall there.
- Don't buy a breakout and then fade the failure of the same breakout. Doing both can mean two losses on the same move when the market chops sideways.
- Note the time of day of each false breakout you trade. After a few weeks you'll know when your market fakes out most.
FAQ
Should I place a pending order just beyond a range to catch the breakout?
Only if you accept that many of those orders will be filled by false breakouts. A safer approach is to wait for a close outside, then decide between trading the breakout and fading the failure.
What timeframe is best for trading false breakouts?
Any timeframe shows them. On 1-minute and 5-minute charts, normal noise creates many breaks that mean nothing. The 1-hour and 4-hour charts give fewer, clearer signals, but your stops need to be wider.
How many pips beyond the level should I wait for before calling it a breakout?
No single pip count works on every pair and timeframe. Judge the candle close first. Then measure what a normal candle is on that chart: look at the last 20 candles and estimate their average size from high to low. A close that lands beyond the level by less than that average is easy to reverse, so treat it with suspicion.