









Breakout retest
Also called Break and retest, Breakout and retest, Retest entry, Break-retest
A breakout retest is when price breaks through a support or resistance level, then comes back to touch that level from the other side and holds. Traders use the retest as a calmer entry than the breakout candle itself.
Buying the breakout candle itself means you enter at the most stretched price, with your stop far away. Many breakouts also fail. Waiting for the retest lets you see the old level hold before you commit, and it gives your stop loss an obvious place to go.
How to spot a breakout retest: the 6-point checklist
Work through these steps in order. If any step fails, you don't have a retest yet. The steps describe the bullish version. In a bearish retest, everything flips: price closes below support, rallies back up to it, and the old support caps price as resistance before it falls.
- Find a real level. You need a price where the market turned at least once before, such as a swing high that acted as resistance or a swing low that acted as support.
- Wait for a close beyond it. A breakout only counts when a candle closes past the level. A wick that pokes through and gets pulled back is not a breakout.
- Look for follow-through. After the break, price should keep moving away from the level for at least a candle or two.
- Let price come back. The retest is the pullback that returns to the broken level, or very close to it.
- Check that the level holds from the other side. Old resistance now has to act as support (or old support as resistance). Wicks can dip into the level, but candles should close on the breakout side.
- Wait for a rejection candle, then plan the trade. A candle that closes back in the breakout direction after touching the level is your trigger. Before you enter, put the stop beyond the retest wick, calculate your size, and check that the target is at least twice the risk.
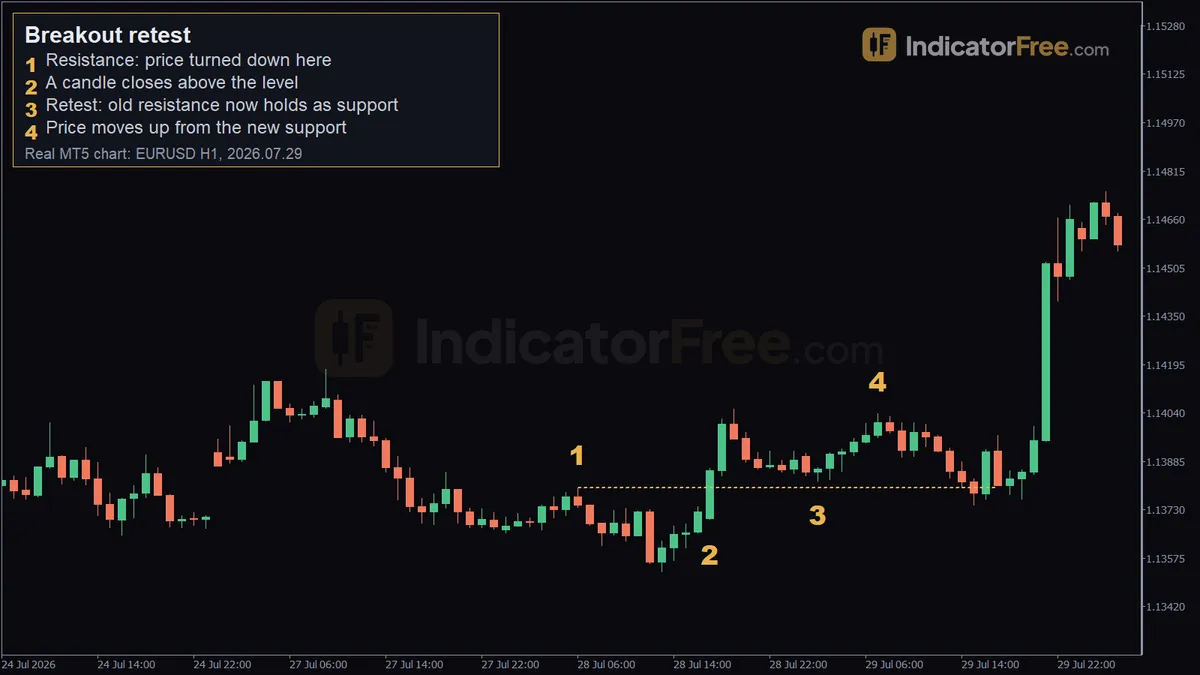
The chart below shows that order on a made-up 1-hour chart. Price turns down at resistance, closes above it, moves higher, pulls back into the old level, and pushes away again.
Reading the EURUSD 1-hour retest, marker by marker
The chart at the top of the page is a past EURUSD 1-hour example. It shows what happened and does not predict anything.
- Marker 1, the resistance. On 2026.07.28 at 06:00, price turned down at 1.13802. That high is the level you watch.
- Marker 2, the breakout. The candle at 17:00 the same day closed at 1.13857, above the 1.13802 level. That close, not an intraday spike, is the break.
- Marker 3, the retest. On 2026.07.29 at 02:00, price came back to 1.13822 and held. It stopped about 2 pips above the old resistance, so the level was now working as support.
- Marker 4, the move away. By 07:00, price had reached 1.14038, roughly 22 pips above the retest.
The retest held above the old level instead of sinking deep below it. A shallow hold like that is what you want to see.
What makes a retest strong, weak or broken
A strong retest comes back to the level quickly, prints small candles on the way down, and leaves a clear rejection candle at the level. The breakout candle before it had a solid body and closed well past the level.
A weak retest sends long wicks deep through the level, while the candle bodies still close on the breakout side. It can still work, but your stop has to sit beyond those deeper wicks, so it is wider and the trade is less clean.
A broken retest closes back inside the old range and keeps going. At that point the breakout was a false breakout. Treat it as a failed setup, not as a better entry.
The most common mistake is reading every wick as a failed retest. Use this rule: if price only wicks through the level, the retest is still alive. If a candle body closes clearly back inside the old range, stand aside or exit.
Placing entry, stop loss and target on a retest
There are two ways to enter. A conservative entry waits for the trigger candle to close, then buys (or sells) at the next open. An aggressive entry rests a limit order at the level before price gets there. You get a better price, but you also get filled on retests that fail.
Put the stop loss on the far side of the level, beyond the retest's wick. Then the trade is only wrong if the level actually fails. For a first target, use the breakout high, or measure the distance you are risking and aim for at least twice that. If the breakout high is closer than twice your risk, skip the trade or use the target at twice your risk instead.
To see what the retest saves you on a real chart, take the EURUSD example and put the stop a couple of pips under the old resistance at 1.13802. The retest low was 1.13822, 2 pips above that resistance. A buy limit resting at 1.13802, or a pip above it, would never have filled, because price turned 2 pips early. A conservative entry after the trigger candle would still have caught the move. So if you use a limit, place it at the upper edge of the retest zone (the breakout side), not on the exact line, or accept that shallow retests will leave you out. Buying the breakout close at 1.13857 puts you 5.5 pips above the resistance. With the stop at the same price, a fill near the retest low carries 3.5 fewer pips of risk than the breakout close on the same trade idea.
The calculation below is an illustrative example with round numbers, not taken from the chart. You buy after the retest, place your stop 10 pips below your entry, beyond the old level, and target 30 pips above. The account is $10,000 and you risk 1%. For the comparison, you buy the breakout candle's close instead, 10 pips higher, and keep the same stop price and the same target price. Your stop is now 20 pips away and your target only 20 pips away.
Same account, same risk, same stop and target prices. The retest entry makes three times what it risks, a 3:1 reward-to-risk ratio. The breakout entry risks 20 pips to make 20, only 1:1, so it has to win much more often just to break even. That trade-off is the reason traders wait for the retest.
When breakout retests work and when to skip them
Retests tend to behave best when the broken level is obvious and was tested more than once, when the higher timeframe trend points the same way, and when the breakout happens during busy session hours, not in a quiet overnight market.
Skip them right before major news, where a spike can run through any level. Skip them in choppy, sideways markets, where price crosses the same line again and again. Set a time limit too: if price hasn't come back to the level within the next handful of candles after the break, drop the setup, because the breakout momentum is usually gone by then.
Three habits keep you on the right side of these conditions:
- Mark the level before the breakout happens. A line you draw afterwards tends to fit what you want to see.
- Check the higher timeframe. A 1-hour retest that runs straight into daily resistance has little room to move.
- Don't tighten the stop above the retest wick while price is still testing the level.
Waiting has two costs. Fast moves may never come back, so you will miss some trades. The wait can also make you second-guess a valid setup. If every checklist step passes, take the trade as planned.
FAQ
Does every breakout come back for a retest?
No. Strong breakouts driven by news or heavy buying often never return to the level. That is why you need a time limit, and why it is fine to miss a trade.
Which timeframe is best for breakout retests?
The pattern looks the same on any timeframe, but levels on the 1-hour, 4-hour and daily charts are watched by more traders and tend to hold better. On a 1-minute or 5-minute chart, random noise produces many fake retests.
What if price retests the level twice?
A second touch is still a valid retest as long as the candle bodies stay on the breakout side. Keep your stop beyond the lower of the two wicks (the higher one in a bearish retest). If each touch digs deeper into the level, the new support is weakening, so skip the trade.