









Spike
Also called Price spike, Volatility spike, Price surge
A spike is a sudden price move, usually within one or a few candles, that is several times larger than the market's normal range just before it. The normal range is often measured with the Average True Range (ATR).
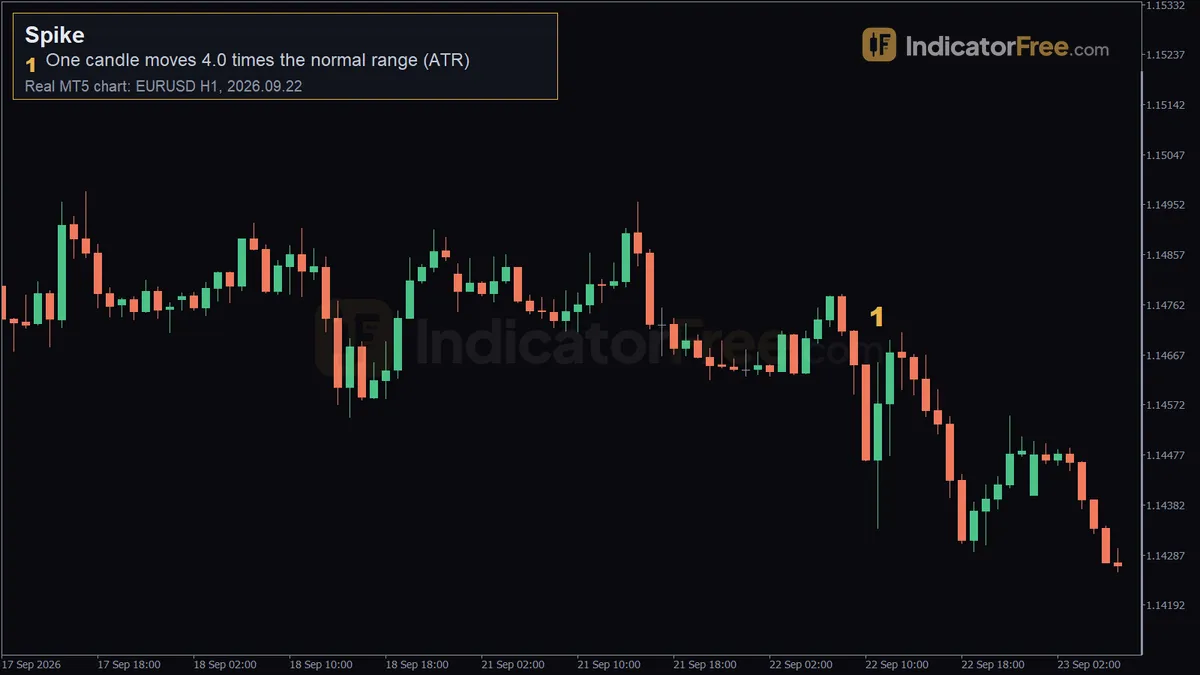
Spikes are where stop losses get hit, spreads widen and orders fill at worse prices than you planned. If you spot one quickly, you can decide whether to follow it, fade it or stay out. Size alone does not make a spike. A candle that is normal on a busy afternoon can be a spike on a quiet morning.
How to identify a spike on your chart
- Measure the candle's range (high minus low) in pips, or in dollars on gold.
- Read the 14-period Average True Range (ATR) on the candle before the move. ATR is the average candle range over recent candles. Using the earlier reading stops the spike from inflating the number you compare it with.
- Divide the range by that ATR. Many traders call 3 or more a spike. Pick your own threshold and keep it fixed.
- Compare the candle with what that hour of the day normally does, not only with ATR.
- Look at the body. A large body that closes near the high or low shows a push in one direction. A long wick with a small body shows that price was rejected.
- Look for a cause: a scheduled data release, a headline, a session open or a thin market.
What makes a spike strong, weak or false
A strong spike is wide compared with both ATR and its session. Its body covers most of the range, and the next candle does not erase it. Price holds beyond the level the spike broke.
A weak spike is mostly wick. Price shot out and came back before the close. It shows you where orders were rejected, not where price is heading.
A false spike comes from the data, not from real trading. Examples are a single stray tick that appears on one price feed only, a jump across the weekend gap, or a minute with very wide spreads around the daily rollover. Any of these can print a huge candle that almost nobody traded at. If there is no cause and other timeframes don't confirm it, treat it as noise.
A common misread: most charts draw the bid price, but buy orders fill at the ask. When the spread widens, the ask can jump while the bid line barely moves. A short trade's stop can then trigger at a price your chart never shows. That is a spread spike, not a price spike.
Reading the 22 September 2026 EURUSD spike
The chart at the top of the page is a past example from the EURUSD 1-hour chart, not a prediction. The marker "one candle moves 4.0 times the normal range (ATR)" sits on the 2026.09.22 11:00 candle at 1.14653.
- Range: the candle moved 31 pips from low to high.
- Yardstick: the 14-period ATR before it was 8 pips, so the candle was 4.0 times the normal range.
- Context: an 8-pip ATR is quiet for this pair. On the Lab's EURUSD 1-hour data from 2025-10-02 to 2026-10-02, ATR(14) averaged 11.7 pips, and half of the candles had an ATR below 10.9 pips. This is past data, not a forecast.
The spike came after a calm stretch. When ATR is low, stops placed for the quiet market sit close to price and are easy to sweep. The facts give the candle's range but not its close. On your own chart, the next thing to check is where a spike like this closed within its range.
Judging a spike against its trading session
ATR alone can mislead you, because each session has its own pace. The chart below shows the Lab's average 1-hour candle range on EURUSD by session (server time, 2025-10-02 to 2026-10-02; past data, not a forecast).
The 11:00 candle falls in the London morning window, where the average 1-hour range was 13.1 pips. At 31 pips, it was more than twice that. The same candle during the overlap, which averaged 17.8 pips, would have been less unusual.
Gold follows a different pattern. On XAUUSD 1-hour data for the same period, the Asian hours averaged 21.3 $ per candle, which is more than the London morning's 18.9 $. The overlap averaged 30.9 $. Don't assume Asian hours are quiet on every market.
A rule you can use: if a candle beats your ATR threshold and is at least twice its session's average range, treat it as a spike. If it beats the threshold only because ATR was unusually low, wait one more candle before you act.
Two ways to trade a spike
This entry has no setup chart from the Lab, so both setups below use rules, and the first one uses an illustrative example.
Buying the pullback after a strong-body spike
The figures in this setup are an illustrative example. Assume EURUSD has been drifting in a narrow band with a 14-period ATR of 10 pips. Then one candle runs 40 pips from its low to its high and closes 4 pips below its high.
- Confirm: a 40-pip range divided by a 10-pip ATR gives 4.0, and the body closes near the high. That makes it a strong spike.
- Entry: place a buy limit at the spike's midpoint, 20 pips below its high. Two candles later, price pulls back and fills it.
- Stop loss: five pips under the spike's low, which puts it 25 pips below your entry. If price returns below the level where the spike started, the push has failed.
- Target: the entry plus the spike's own 40-pip range.
- Size: a standard lot (100,000 units) is worth $10 per pip on EURUSD. The steps below size the trade for a 1% risk.
Fading a wick spike that gets rejected
- Confirm: the range is at least 3 times ATR, the wick is at least two-thirds of the range, and the candle closes back inside the range price held before the spike.
- Entry: at the open of the next candle, trading against the direction of the wick.
- Stop loss: beyond the tip of the wick, plus the spread and a small buffer. The tip marks where the rejected orders were. If price breaks it, the rejection has failed.
- Target: the far side of the range before the spike. If that range is wide, take part of the profit at its midpoint.
- Skip it while a news release is still unfolding, because a second burst in the same direction can follow.
When spikes are worth trading and when to stay out
Spikes are easier to trade once the news has printed, the spread is back to normal and the spike has broken a clear level. They are harder to trade in the minutes before major releases, around the daily rollover and at the weekend open.
Be careful too when volatility is already extreme. On the Lab's 1-hour data (2025-10-02 to 2026-10-02), the highest 10% of ATR readings were above 16.2 pips on EURUSD and above 32 $ on XAUUSD. This is past data, not a forecast. At those levels, a 3x spike needs a very wide stop.
| Point | Upside | Downside |
|---|---|---|
| Information | Shows where large orders hit the market | Can be a data error or a spread effect |
| Entries | A pullback gives a clear stop at the spike's starting point | Buying or selling at the spike's close needs a wide stop |
| Measurement | The range-to-ATR ratio gives you an objective filter | The ratio is distorted when ATR was unusually low |
| Follow-through | A strong body can mark the start of range expansion | A wick spike can reverse completely |
Bullish and bearish spikes
A bullish spike is a sudden jump upward. When you follow one, place your stop below the level where it started. A bearish spike is a sudden drop. It can run further than the news alone justifies, because stop losses on buy trades turn into market sell orders. When spikes repeat and ranges stay wide, read the separate entries on range expansion and volatility expansion.
Practical tips for trading around spikes
- Never enter while the spike candle is still open. Wait for it to close.
- Measure ATR on the candle before the spike, never on the spike itself.
- If you widen your stop, cut your lot size so your risk in money stays the same.
- Check the spread before you click. During a spike it can be far wider than usual.
- Log each spike: its ratio, the session, body or wick, and what happened next. Your own records will tell you more than any rule of thumb.
- If a spike stops you out, don't re-enter during that same candle.
Quick checklist
- Is the range divided by the ATR before it at or above your threshold?
- Is it at least twice the session's normal 1-hour range?
- Is it mostly body (follow it) or mostly wick (fade it)?
- Is the cause known and the spread back to normal?
- Is your stop beyond the spike's start or the wick tip, with lot size cut to match?
FAQ
What is an algo spike in trading?
It is a spike driven by automated orders, where trading programs react to a headline, a price level or each other within fractions of a second. On the chart it looks like any other spike. The main difference is speed, so the same rule applies: wait for the candle to close.
What does a volume spike mean in forex?
Spot forex has no central exchange, so the volume on your chart is usually tick volume, meaning the number of price changes. A tick-volume spike shows that many quotes changed at once. A price spike without one is more likely to be a data error.
How long should I wait after a news spike before entering?
Wait until the spread is back to its usual size and at least one full candle on your trading timeframe has closed after the spike. Then run the checklist above.