Keltner Channel
Also called Keltner Channels, Keltner Bands, KC
The Keltner Channel is a volatility indicator. It draws a moving-average middle line and two bands set a multiple of the Average True Range above and below it, so you can see when price is stretched or breaking into a trend.
The band distance comes from recent candle size, so a close outside the channel means price moved further than current volatility usually allows. Read together with the slope of the middle line, that close tells you whether a move is a trend starting or a stretch that may snap back. Mixing up the two is how traders buy the top of a range or short the start of a trend.
The three lines of a Keltner Channel and what each tells you
Middle line. This is an exponential moving average (EMA, an average that gives more weight to recent closes). Its slope is your trend read: rising, falling or flat.
Upper band. This is the middle line plus a multiple of the Average True Range (ATR). ATR is the average size of recent candles, counting gaps. The upper band shows how far above the average price normally travels in today's conditions.
Lower band. This is the middle line minus the same distance. It mirrors the upper band.
Channel width. The gap between the bands equals 2 × multiplier × ATR. It widens when candles get bigger and narrows when the market goes quiet. ATR moves slowly, so Keltner bands stay smoother than bands built from closing-price swings.
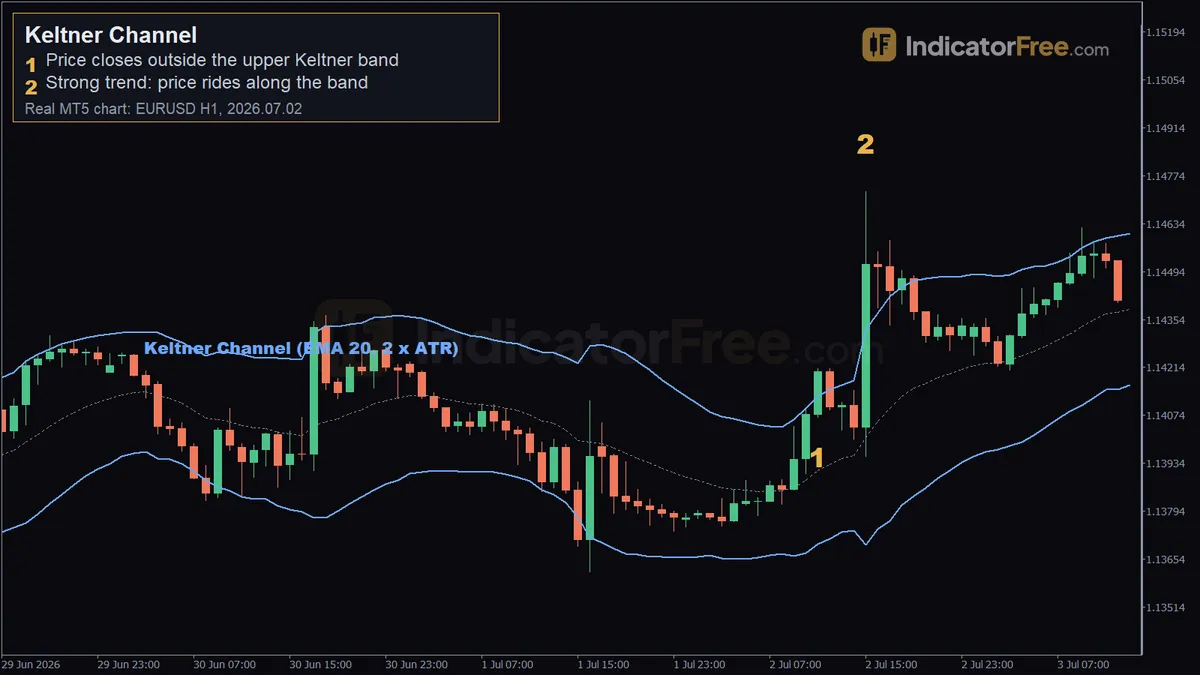
The drawing below shows the parts, plus the two price behaviours you will use most: a close outside the band and a ride along it.
Working out the bands yourself
The numbers here are an illustrative example. Say you are on a 1-hour chart. ATR is 15 pips and the multiplier is 2.
This sum gives you your risk before you trade. If you buy a close at the upper band and put your stop at the middle line, you risk about one band distance, here 30 pips. If that is too much for your account, skip the trade or reduce your size.
Keltner Channel inputs and what changing them does
| Input | What it sets | What changing it does |
|---|---|---|
| EMA period | Length of the middle average | Shorter: hugs price, gives more signals and more noise. Longer: smoother, slower trend read |
| ATR period | Number of candles in the range average | Shorter: bands jump quickly after a volatility spike. Longer: steadier bands |
| ATR multiplier | Distance of the bands from the middle | Higher: fewer closes outside, and each one means more. Lower: more touches and more false breakouts |
| Applied price | Price the average is built from (close or typical price) | Typical price, (high + low + close) ÷ 3, smooths the middle line slightly |
| Average type | EMA or simple average | A simple average reacts more slowly to turns |
Default values differ between indicator versions. Check the inputs on your copy before you compare your chart with anyone else's.
Keltner Channel signals and how to read each one
A close outside the band: momentum, not overbought
The most common misread is selling because price is "above the channel". In a trending market, a close outside the band in the direction of the slope shows strength.
The chart at the top of this page is a past example, not a prediction. On EURUSD 1-hour, the 11:00 candle on 2 July 2026 closed at 1.14201. That was above the upper Keltner line at 1.14130, about 7 pips outside. Price then rose 53 pips over the next 15 candles.
Only the close counts. A wick that pokes through and closes back inside is a test, not a breakout.
Riding the band: trend still healthy
In a strong trend, candles keep closing near the outer band rather than returning to the middle. On the same chart, the 15:00 candle at 1.14727 was still travelling along the upper band.
While closes stay between the middle line and the outer band, the trend is intact. The first close back through the middle line is your warning.
Pullback to the middle line: continuation entry
When the EMA slopes clearly, a dip to the middle line that holds is often a calmer entry than chasing the band. You want a candle that touches or slightly pierces the EMA and then closes back on the trend side.
Close back inside a flat channel: fade toward the middle
When the middle line is flat, the market is ranging. A candle that pushes outside a band and the next candle that closes back inside suggest the push failed. The middle line is the natural target.
Narrowing channel: a market winding up
A channel that keeps getting narrower shows candles shrinking. Quiet phases are where breakouts start, but the width does not tell you the direction. Wait for the first close outside.
When the Keltner Channel works and when to stand aside
It works well:
- in trending sessions where the middle line has a clear slope;
- after a long narrow channel, when the first close outside starts a new move;
- on 1-hour charts and higher, where one odd candle matters less;
- in markets whose volatility changes gradually rather than in sudden jumps.
Avoid it or step back:
- right before and during major news, because ATR lags and the bands are set for the calm before the spike;
- in thin hours, when one wide-spread candle can print a false close outside;
- in breakout mode when the middle line is flat and price keeps crossing it;
- just after a huge spike, when the channel has blown wide and stops at the middle line become too large.
Keltner Channel pros and cons
| Pros | Cons |
|---|---|
| Bands adjust to volatility automatically | ATR lags sudden volatility changes |
| Bands move smoothly because ATR changes slowly | Says nothing about direction until price picks one |
| One tool covers trend, pullback and range signals | The same close outside means opposite things in trend and range |
| Band distance turns straight into a stop size | Settings vary by version, so charts don't always match |
Keltner Channel trading setups with entries, stops and exits
Breakout and ride: EURUSD 1-hour, 2 July 2026
- Entry trigger: a full candle closes outside the upper band while the middle line rises. Here the 11:00 close was 1.14201, above the 1.14130 band. Enter on that close or at the next candle's open.
- Stop loss: below the middle line at the time of entry. Your risk is the gap from your entry to the middle line: one band distance (multiplier × ATR) plus however far outside the band you entered, here about 7 pips.
- Exit: hold while candles ride the band, as the 15:00 candle at 1.14727 did. Exit on the first close back below the middle line. You can also take part of the trade off when the candles stop reaching the band.
This is a past example, not a forecast. Many breakouts fail and fall back inside within a few candles.
Pullback to the EMA in an uptrend
This setup uses the same illustrative channel: the EMA is rising and the upper band sits 30 pips above it. Assume the EMA barely moves during the pullback.
- Entry trigger: price dips to a low 5 pips under the EMA. A candle then closes back above it, 10 pips above the EMA. Buy that close.
- Stop loss: 5 pips under the pullback low, so 10 pips below the EMA. Your risk is 10 + 10 = 20 pips.
- Exit: take half at the upper band, 30 pips above the EMA, which is 20 pips of profit. Trail the rest and close it on a close below the middle line.
- Size: on a $10,000 account risking 1%, you risk $100. $100 ÷ 20 pips = $5 per pip. A standard lot (100,000 units) of EURUSD is worth $10 per pip, so you trade 0.5 lots (50,000 units).
Fade in a flat channel
- Entry trigger: the middle line is flat. One candle closes below the lower band, and the next closes back inside. Buy that close.
- Stop loss: a few pips beyond the lowest wick of the push.
- Exit: at the middle line. If the middle line starts to slope against you, close the trade early.
The chart below shows this sequence on an illustrative flat channel: the push below the band, the close back inside, and the drift back to the middle line.
Keltner Channel settings for day trading, swing trading and scalping
These are starting points to test on your own pair, not proven values.
| Style | Chart | EMA period | ATR period | Multiplier |
|---|---|---|---|---|
| Scalping | 1- to 5-minute | 20 | 10 | 1.5 |
| Day trading | 15-minute to 1-hour | 20 | 10 | 2 |
| Swing trading | 4-hour to daily | 20 to 50 | 20 | 2 to 2.5 |
The bands scale to ATR, so gold's larger moves are already built in. Gold produces more sudden spikes than the major FX pairs, though. Many traders raise the multiplier slightly on gold so that one spike candle does not count as a breakout.
Pairing the Keltner Channel with ADX to pick the mode
The ADX (Average Directional Index) measures trend strength without direction. Use it to decide which Keltner signals you are allowed to take:
- If ADX is above 25 and rising, take only trend-direction closes outside and pullbacks to the EMA.
- If ADX is below 20, take only fades back inside the channel.
- If ADX is between 20 and 25, stand aside or trade smaller.
This filter stops you fading a band just as a market starts to trend.
Quick checklist before a Keltner trade
- Is the middle line sloping (trend mode) or flat (range mode)?
- Did a full candle close outside, or back inside, the band? If it is the first close outside a long narrow channel, don't fade it: that is the breakout, not the stretch.
- Is the stop distance (middle line or wick) within your risk for this trade?
- Is major news due before your exit? If news has just hit, give ATR a few candles to catch up before you trust the band levels.
Not to be confused with Bollinger Bands
Both draw three lines around price, and they get swapped constantly. Bollinger Bands set the band distance with the standard deviation of closes, so they swell and pinch much more sharply. Keltner bands use ATR and move more smoothly. A distance of 2 × ATR is not the same as 2 standard deviations, so on the same chart, check which sits outside the other: in a quiet range, Bollinger Bands often sit inside the Keltner Channel.
FAQ
Does the Keltner Channel repaint?
Once a candle has closed, its band values stay fixed. On the live candle, the EMA and ATR keep updating with every tick, so the bands move until the close. That is why every signal above waits for the close.
Why do my Keltner bands look different from someone else's chart?
There are two versions. Chester Keltner's original channel used a 10-period simple average of the typical price, with bands based on the average high-low range. The later version, popularised by Linda Raschke, uses an EMA with ATR bands. Different versions or settings give different lines on the same candles.