









Volatility expansion
Also called Range expansion, Volatility breakout, ATR expansion, Expanding volatility
Volatility expansion is when a market moves from small, quiet candles to clearly larger ones, so the average distance price travels per candle rises. Traders usually measure it with the Average True Range (ATR).
If you spot an expansion early, you learn two things before you place an order. Your usual stop is now too tight, and the market may be starting a real move. Traders who miss the change keep using stop sizes from the quiet market, and normal swings take them out.
How to confirm a volatility expansion: a 6-step checklist
The Average True Range (ATR) is the average high-to-low distance of the last few candles, and it counts gaps too. With a 14-period ATR, the average covers the last 14 candles. When ATR rises, candles are getting bigger. ATR tells you nothing about direction.
- Find the quiet stretch first. You need several candles with small ranges and a flat or falling ATR. An expansion has to grow out of something smaller.
- Measure the jump. Divide the current ATR by its value just before the move. Around 1.5 or more is a clear expansion. Below about 1.2 is normal noise.
- Check the candles as well as the ATR line. The new candles should be clearly wider than the quiet ones, with bodies that fill most of each candle.
- Look for a break. Price should leave the quiet range, not swing back and forth inside it.
- Check the clock and the calendar. Note which trading session it happened in and whether a scheduled news release set it off.
- Compare with history. Ask whether the new ATR is high for this market and timeframe, not just higher than an hour ago.
For step 6, the IndicatorFree Lab counted past broker demo data from 2025-10-02 to 2026-10-02. On EURUSD 1-hour charts, ATR(14) averaged 11.7 pips. Half the candles had ATR below 10.9 pips, and the highest 10% were above 16.2 pips. On EURUSD 4-hour charts the average was 24.1 pips, with the top 10% above 32.9 pips. On gold (XAUUSD) 1-hour charts the average was 21.9 $, with the top 10% above 32 $. This is past data, not a forecast.
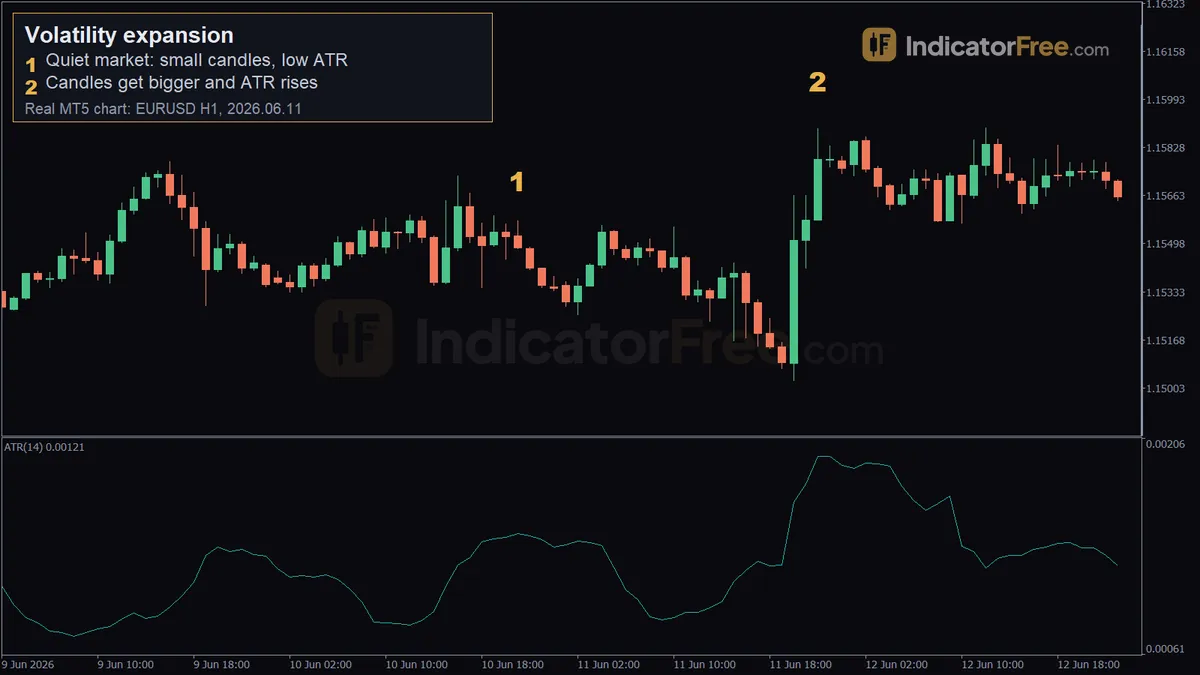
The chart below shows the shape you are looking for. First the candles shrink and ATR drifts lower. Then a wide candle breaks out and ATR climbs over the next few bars.
Telling a real expansion from a false spike
A valid expansion builds over several candles. ATR keeps rising, candles close near their highs or lows, and price stays outside the old quiet range.
A weak one rests on a single candle. A typical case is one news candle with long wicks on both sides. ATR jumps once, then the next candles shrink back to their old size. A gap at the start of a session can look the same: it lifts ATR, but price doesn't keep moving in either direction.
An expansion is broken when price moves back inside the quiet range and ATR goes flat. At that point the market has turned down the move, so treat any trade based on it as wrong.
A common misread: ATR stays high for a few candles after a big candle even once price has calmed down, because that big candle is still inside the 14-candle average. Look at the size of the latest candles, not only the ATR line.
Reading the EURUSD 1-hour example: ATR from 11 to 18 pips
The chart at the top of the page is a past EURUSD 1-hour example, not a prediction.
- Marker 1 (2026.06.10 21:00, 1.15577): the quiet market. Candles are small and the 14-period ATR averaged about 11 pips. That is close to the Lab's 10.9-pip middle value for this pair and timeframe.
- Marker 2 (2026.06.11 22:00, 1.15894): the candles get bigger and ATR rises to 18 pips. 18 ÷ 11 is about 1.6, which clears the 1.5 bar in the checklist.
History adds a second point. 18 pips is above the 16.2 pips that only the highest 10% of EURUSD 1-hour candles reached in the Lab's 12 months. So this was an unusual reading for the pair, not just a busy hour.
Volatility expansion setups: entry, stop and target
There is no setup chart for this entry, so the rules below use ATR multiples instead of fixed prices. They are rules, not results. Test them on your own charts before you risk money.
Breakout from the quiet range
- Entry: when the first candle closes outside the quiet range and is at least 1.5 times as wide as the ATR before the break.
- Stop loss: just past the opposite side of the quiet range. If that is closer than 1 times the current ATR, widen it to 1 ATR.
- Target: twice the distance from entry to stop. You can also project the height of the quiet range from the breakout point.
First pullback after the expansion candle
- Entry: wait for price to pull back into the body of the first wide candle. Enter when the next candle closes back in the direction of the breakout.
- Stop loss: past the end of the pullback, and at least 1 times the current ATR away.
- Target: the high or low of the expansion candle plus 1 ATR, or twice your risk.
Resizing your position after ATR expands
This matters most for your money. A wider stop with the same lot size means a bigger loss. The illustrative example below keeps the money at risk fixed while the stop follows ATR. It uses a $15,000 account and the textbook $10 per pip for 1 standard lot on EURUSD.
Decision rule: if ATR doubles, cut your position in half. Don't keep the old size with a stop that is now too tight.
When volatility expansion works and when to skip it
Timing matters because some hours are busy by habit. The bars below show the Lab's average EURUSD 1-hour candle range by session (server time, 2025-10-02 to 2026-10-02, past data, not a forecast).
If EURUSD candles grow at the London open, that is partly just the clock. Bigger candles in quiet hours tell you more. Gold works differently: its Asian-hours average (21.3 $) was higher than London morning (18.9 $), and the overlap led at 30.9 $. So learn each market's normal daily rhythm before you judge an expansion.
It tends to work better after a long, tight range, when the new candles close firmly and ATR keeps climbing. Skip it in the first minutes after scheduled news, in thin holiday trading, and when ATR has already sat in its top 10% for many candles. By then much of the move has often already happened.
| Pros | Cons | |
|---|---|---|
| Measurement | Easy to measure with one ATR ratio | ATR lags because it averages past candles |
| Risk | Tells you when to widen stops and cut size | Wider stops mean smaller positions |
| Timing | Marks when the market starts to move | Says nothing about direction |
| Filtering | Works on any market and timeframe | News spikes produce false readings |
Bullish and bearish volatility expansion
A bullish expansion has wide candles closing near their highs as price breaks above the quiet range. That points to buyers pushing the move.
A bearish expansion is the mirror image: wide candles close near their lows as price breaks below the range. The opposite state, where candles shrink and ATR falls, is volatility contraction (often called a squeeze) and has its own entry.
Practical tips for trading expanding volatility
- Write down the ATR before the move. You can't calculate the 1.5 ratio after the fact if you don't know where it started.
- Check a higher timeframe. A 1-hour expansion that runs into 4-hour resistance often stalls there.
- Change your lot size as soon as ATR jumps, not after your first wider loss.
- Don't chase the third or fourth wide candle. Wait for the first pullback.
- Recheck ATR while you are in a trade. When candles shrink back to quiet size, the expansion is fading, so tighten your exit plan.
Quick checklist before you act on an expansion
- Was there a quiet range first, and has price closed outside it?
- Is current ATR at least 1.5 times its pre-move value?
- Is it a run of wide candles, not one news spike?
- Did you resize the position so the money at risk stays the same?
FAQ
Can a trading bot trade volatility expansion?
Yes. The rules can be written as code: an ATR ratio threshold, a close outside the recent range, and position size based on ATR. A bot still needs testing on past data and a filter for news times, because news spikes give it the same false signals they give you.
What does volatility expansion look like in the stock market?
The same idea applies. Daily or intraday ranges widen after a quiet period, often around earnings reports or the market open. You measure it the same way, with ATR on the stock's own chart, and compare it with that stock's normal range.
How long does a volatility expansion last?
There is no fixed length. Treat it as over when the latest candles shrink back to their pre-move size and ATR stops rising, even if ATR is still high.