Bollinger Band squeeze
Also called BB squeeze, Bollinger squeeze, volatility squeeze
A Bollinger Band squeeze is when the upper and lower Bollinger Bands move unusually close together, which shows that volatility is at a low. Traders watch for it because quiet periods often end in a sharp move, but the squeeze does not show which way.
Most money lost around squeezes comes from guessing the direction before price has shown it. Treat the squeeze as an alarm, not a signal.
How to spot a Bollinger Band squeeze: a 5-step checklist
The key number is band width. It is the upper band minus the lower band, in pips. A squeeze is a low reading of that number compared with recent history. It is not just bands that look narrow.
- Plot Bollinger Bands with a 20-candle period and 2 standard deviations on closing prices. These are also the MT5 defaults: period 20, shift 0, deviations 2, applied to Close.
- Read the band width on the latest closed candle: upper band minus lower band.
- Compare it with the last 100 candles. If it is the lowest of the 100, you have a squeeze. Some traders also count a reading within a pip or two of that low, but the frequency figures further down count only true new lows, so a looser rule will show you more squeezes than those figures.
- Check what price is doing. You want small candles, a flat middle band and price crossing the middle band back and forth.
- Wait for the trigger. A candle must close outside one band, and the band width must start to grow on that candle.
Steps 1-4 set up the trade. Step 5 is the only one that gives you a direction. The drawing below shows the whole sequence: the bands pinch together, price closes outside, and the bands open up.
Telling a real squeeze from a weak or broken one
A valid squeeze has band width at a true low against a long window, such as 100 candles. It forms after a range or a pause in a trend. On the breakout candle the bands open up clearly.
A weak squeeze comes from the clock, not from the market. Bands shrink every quiet overnight session and on holidays, so a narrow reading at those times is normal. Before you count a squeeze, check the band width at the same hour on previous days. A squeeze that forms just before scheduled news is also weak, because the release can push price through both bands within minutes.
A broken squeeze is the head fake. A candle closes outside one band, then the next one or two candles close back inside and cross the middle band. When you see that, the first breakout has failed.
The most common mistake is treating any close outside a band as a breakout. On EURUSD 1-hour charts from 2025-10-02 to 2026-10-02, 13.2% of candles closed outside Bollinger Bands (20, 2), counted by the IndicatorFree Lab. That is more than one candle in eight (past data, not a forecast). Closes outside the bands are routine. They only mean something right after a squeeze, with the bands widening.
Reading the EURUSD squeeze of 25 September 2026
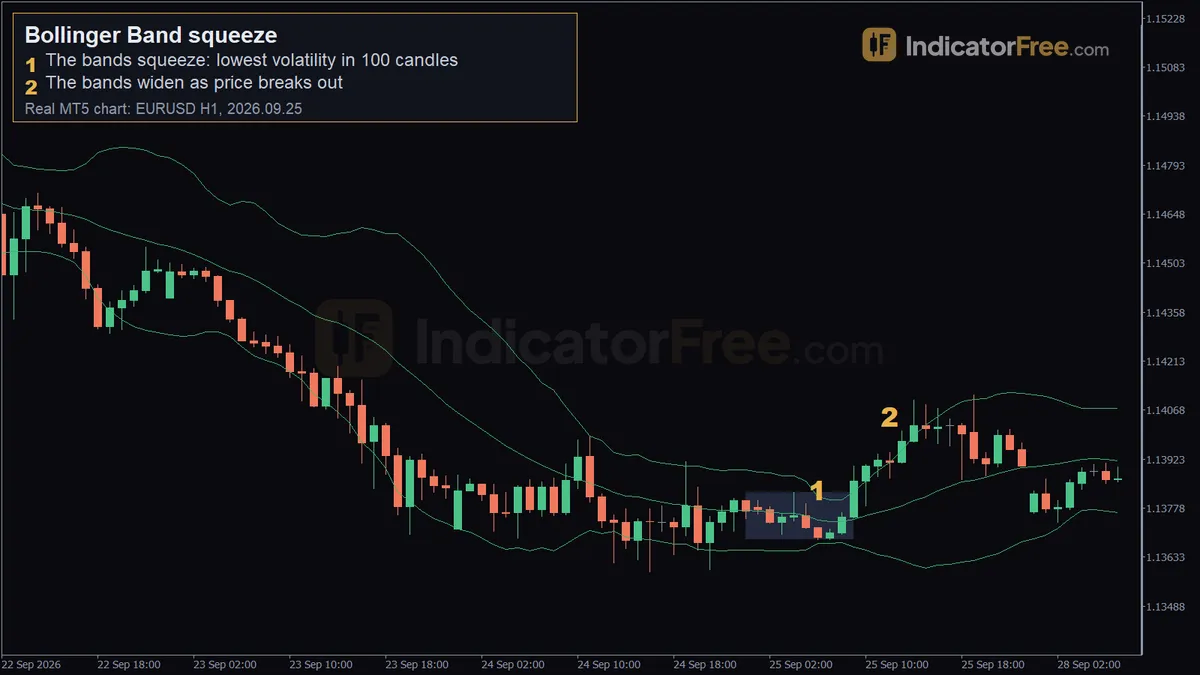
The chart at the top of the page is a past example on the EURUSD 1-hour chart. It is not a prediction.
Marker 1, 06:00 at 1.13721. The Bollinger Bands (20, 2) were 14 pips wide, the narrowest in 100 candles. This is the squeeze. At this point nothing on the chart showed which way price would break.
Marker 2, 12:00 at 1.13942. The bands were twice as wide, so about 28 pips. Price had moved 42 pips in total since the squeeze. The markers show where the bands were measured, not the extremes of the move, so the gap between the two marker prices is smaller than 42 pips. Widening bands with price on the upper side is the confirmation from step 5 of the checklist.
Six 1-hour candles separate the two markers. If you entered at marker 1, you were guessing. If you waited for the bands to widen, you gave up part of the move but traded with a known direction. That trade-off is the core of the squeeze.
Two ways to trade a Bollinger Band squeeze
The numbers in this section are an illustrative example on EUR/USD, given as pip distances. During the squeeze the bands are 20 pips wide, so each outer band sits 10 pips from the middle band.
Setup 1: buy the close outside the band
Entry: a candle closes above the upper band, and the bands start to widen. You buy at that close.
Stop loss: below the middle band and back inside the old range, 20 pips below your entry.
Target: twice the risk, 40 pips above your entry. If a candle closes back below the middle band before the target, exit early. That close means the breakout has failed.
Risking 1% of a $10,000 account, here is how to size the trade:
Setup 2: fade the head fake, then trade the real move
This time price first closes below the lower band. The next candle closes back inside the bands, so the downside break has failed. The drawing below shows the sequence and where the orders go.
Entry: a buy stop just above the high of the candle that closed back inside.
Stop loss: below the low of the fake break, 25 pips from your entry.
Target: 50 pips above your entry, twice the risk. Sellers who shorted the fake break may have to buy back, which can add to the move. If a candle closes back below the low of the fake break, the setup has failed. Your stop handles that, so do not move it.
How often a squeeze appears on EURUSD and gold
The IndicatorFree Lab counted how often band width hit a new 100-candle low over 12 months of broker demo data, 2025-10-02 to 2026-10-02. These counts are past data, not a forecast.
The practical rule: on a 1-hour chart, a true squeeze came about once a week. On the EURUSD 4-hour chart it came less than once a month. If you trade 4-hour charts and see a "squeeze" every few days, your window is too short or you are judging by eye.
When the squeeze works and when to stay out
The squeeze fits best after a long, tight range on a liquid market. It also fits when the breakout lines up with the trend on a higher timeframe, and when the squeeze ends as a busy session opens.
| Pros | Cons | |
|---|---|---|
| Timing | Flags quiet periods before price moves | Says nothing about direction |
| Rules | Objective: width is a number you can measure | The lookback (100 candles) is a choice, not a law |
| Risk | The tight range gives a close, logical stop | Head fakes stop you out before the real move |
| Frequency | Several per month on 1-hour charts | Few on 4-hour charts, so long waits |
Bullish and bearish squeeze breakouts
A bullish squeeze breakout is a close above the upper band with the bands widening. You use the buy setups above.
A bearish squeeze breakout is a close below the lower band with the bands widening. You mirror the setups: sell, with the stop above the middle band.
Practical tips for squeeze trades
- Write the width down in pips. Chart scale changes when you zoom, so narrow-looking bands can fool your eye. The number does not.
- Try 2.5 deviations if you get too many false outside closes. On EURUSD 1-hour, 5% of candles closed outside (20, 2.5) against 13.2% outside (20, 2). On XAUUSD 1-hour the figures were 4.3% against 12.3% (2025-10-02 to 2026-10-02, past data, not a forecast).
- Bracket the squeeze if you cannot watch it. Place a buy stop above the upper band and a sell stop below the lower band. When one fills, cancel the other. This enters on a touch, not a close, so you will be filled on some head fakes; size for that.
- Set stop, target and lot size before you enter. Breakouts from a squeeze move fast, and slippage hurts most on the first candle.
FAQ
Do I need a special squeeze indicator, or can I scan for squeezes?
Standard Bollinger Bands are enough. Many charting platforms also offer a band-width indicator or a screener. Filter for symbols where band width is at its lowest of the last 100 candles, then check each chart against the checklist.
Can I trade the squeeze on a 5-minute chart?
You can, but the bands are only a few pips wide there. The spread and small news spikes then take up a large share of your stop, and head fakes are more frequent. Most traders find the squeeze easier to read on 1-hour charts and higher.