









ATR period
Also called ATR length, ATR lookback, ATR setting, ATR lookback period
The ATR period is the number of candles the Average True Range averages. A short period reacts fast to new volatility; a long period gives a smoother, slower reading.
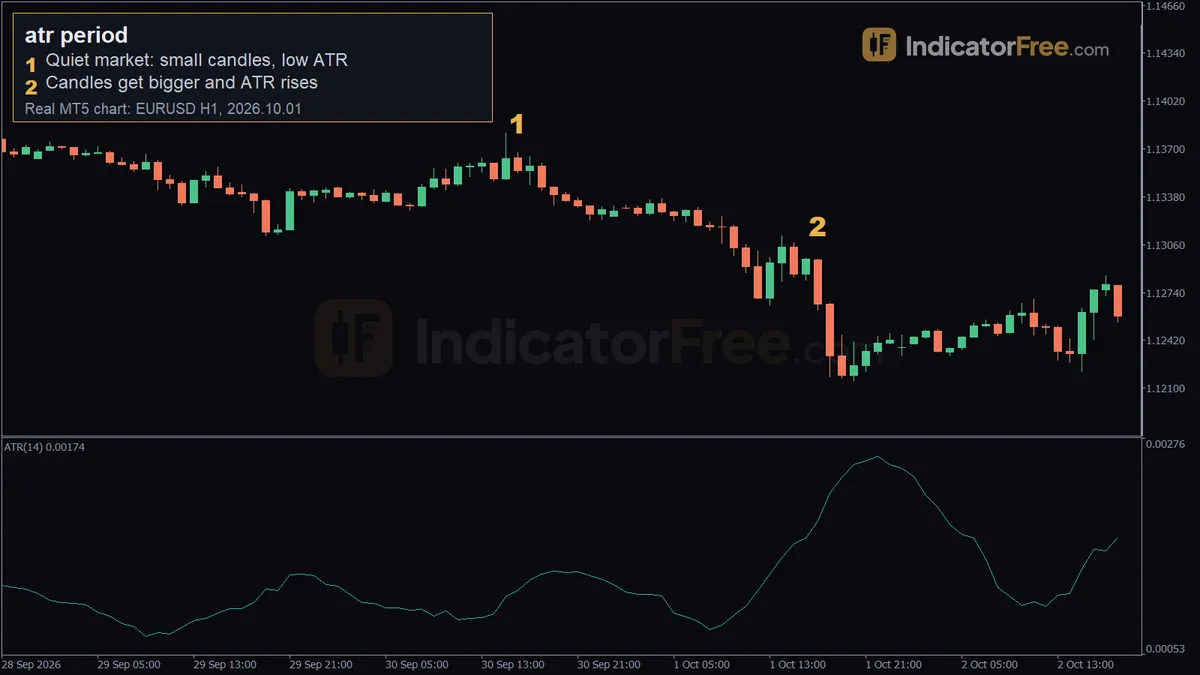
The period decides how quickly your ATR number admits that the market has changed. Most traders use ATR to set stop distance and position size, so a period that is too slow or too jumpy puts the wrong amount of money at risk.
What the ATR period actually counts
ATR averages the true range of recent candles: each candle's high-to-low distance, widened to include any gap from the previous close.
One period is one candle, not one hour or one day. So the same setting covers a different stretch of time on every chart.
| Chart | What 14 periods cover |
|---|---|
| 1-minute | 14 minutes |
| 1-hour | 14 hours |
| 4-hour | 56 hours |
| Daily | 14 trading days |
The reading changes with the chart too. In the IndicatorFree Lab count on EURUSD (about one year to 2026-10-23, broker demo data), ATR(14) averaged 11.6 pips on the 1-hour chart and 24 pips on the 4-hour chart. This is past data, not a forecast.
Notice the candle is four times longer but the ATR is only about twice as big. Never carry an ATR value from one timeframe to another: read it on the chart you trade.
Short period vs long period on the same market
A short period averages few candles, so each new candle moves the line a lot. A long period averages many, so each new candle moves it only a little.
The chart below uses the real EURUSD 1-hour candles from 2026.10.01, 07:00 to 19:00, the same day as the example at the top of the page. Both lines are simple averages of true range, worked out from those candles and the ones before them.
At 07:00 both lines read about 8 pips. After the two 32-pip candles at 12:00 and 13:00, the 7-period line had reached 20 pips while the 14-period line was still near 14. At 16:00 a smaller candle pulled the 7-period line down a little, while the 14-period line kept rising. By 19:00 the 7-period read about 30 pips and the 14-period about 24.
Neither line is wrong. You are choosing between a number that is current but noisy and one that is stable but stale.
The EURUSD 1-hour example, marker by marker
The chart at the top of the page is a past example, not a prediction. It shows a 14-period ATR on EURUSD, 1-hour candles.
- Marker 1 (2026.09.30 16:00, price 1.13677): a quiet market. The candles are small and the ATR is low; the marker stands for the quiet stretch as a whole, so read the average rather than an odd single spike such as the 15:00 candle just before it. Before 2026.10.01 17:00 the 14-period ATR averaged 11 pips.
- Marker 2 (2026.10.01 17:00, price 1.12961): the candles get bigger, and from here the ATR stays raised at about 17 pips on average, 1.6 times the earlier 11.
The lesson is in the gap between the two markers. A stop sized from the quiet reading at marker 1 would have been too tight for the candles at marker 2. With 14 periods, the line needs several candles before it fully shows the new conditions.
How to choose an ATR period: a checklist
- Name the job. Stop distance, position size, a trailing stop or a volatility filter each tolerate a different amount of lag.
- Count how many candles you usually hold a trade.
- Pick a period that covers more candles than you hold, so no single candle can swing the reading. Don't go so long that it describes conditions that have already passed. An average of 50 candles describes a market you will not be in if you hold for 8.
- Multiply the period by the candle length to see the time window, as in the table above. Check what that window mixes together.
- Scroll back to a few large news candles. See how many candles the ATR took to rise, and how long it stayed high afterwards.
- Change one thing at a time. If you change the period, re-check the ATR multiplier you use with it.
The setting of 14 is the most widely used starting point, and it is the one in the Lab numbers here. Move away from it only when step 3 or step 5 gives you a reason.
A period that fits vs a period that misleads
A period fits when the line moves in steps you can follow. It rises within a few candles of a real change, and it does not rewrite your lot size on every candle.
A period is too short when one news candle sends the line up sharply and it collapses again soon after. Your stops then become wide exactly after the move has happened, and tight again just before the next one.
A period is too long when the candles on the chart are plainly bigger than the ATR says. The decision rule in the day-trading section below tells you when to act on it.
One common misread: a rising ATR is not an uptrend. It only says candles are getting bigger.
ATR period for day trading: the session problem
Intraday volatility has a daily rhythm, and a 14-period ATR on a 1-hour chart averages across it. The chart below uses the Lab count for EURUSD 1-hour candles (2025-10-22 to 2026-10-23, 6222 candles, broker demo data, hours in broker server time; past data, not a forecast).
The overlap candles averaged 17.8 pips while the ATR(14) averaged 11.6 pips across all hours. Fourteen 1-hour candles reach back into the quiet hours, so the reading can understate the session you are about to trade.
Decision rule: if the last three or four candles are each larger than the ATR, treat the ATR as stale. Either widen the stop by hand or use a shorter period for that session.
The rhythm depends on the symbol. On XAUUSD 1-hour candles (2025-10-22 to 2026-10-23, same kind of data), Asian hours averaged 20.9 $, London morning 18.5 $, the overlap 30.4 $ and late New York 18.3 $. Gold's Asian hours were not the quietest in that sample, so do not copy EURUSD assumptions across.
Worked setup: stop, target and lot size from the ATR
The figures here are an illustrative example. You have a $10,000 account, risk 1% per trade, and buy a USD-quoted pair. Your ATR reads 20 pips and you place the stop 2 ATRs away. A standard lot is worth $10 per pip.
- Entry: buy at the current price.
- Stop loss: 40 pips below the entry.
- Target: 80 pips above the entry.
Now the period matters. Suppose a shorter period reads 25 pips because it has already absorbed the latest large candles. The stop becomes 50 pips and the size becomes $100 ÷ (50 × $10) = 0.20 lots. The risk is the same $100, with a wider stop and a smaller position.
When each period length helps, and when to avoid it
A shorter period suits fast intraday trading and markets that change character within a session. A longer period suits swing trades and position sizing, where you want the size to stay steady from day to day.
Avoid very short periods around scheduled news, where one candle distorts the reading. Avoid very long periods right after a clear regime change, as in the EURUSD example.
| Period | Window on a 1-hour chart | Window on a daily chart | Pros | Cons |
|---|---|---|---|---|
| 7 | 7 hours | 7 trading days | Shows new volatility fastest | Jumpy; one news candle changes stops and lot size |
| 14 | 14 hours | 14 trading days, about three weeks | Balanced; matches most published examples | Still late at session opens and after news |
| 21 | 21 hours | 21 trading days, about a month | Smoother stops and sizing than 14 | Slower to admit a change in volatility |
| 50 | 50 hours, about two days | 50 trading days, about ten weeks | Very stable stops and sizing | Understates a market that has just woken up |
In practice, on EURUSD 1-hour candles the window decides which sessions you are averaging. A 7-period ATR read at the end of the London/New York overlap is mostly made of busy hours, while 14 or more periods reach back into the quiet Asian hours. In the Lab sample those two sessions averaged 8.8 and 17.8 pips per candle. Once the window passes a few hours, it starts mixing quiet and busy sessions, and the reading drifts toward the all-day average of 11.6 pips.
Practical tips for setting the period
- Plot two periods together for a week. When the short line sits well above the long one, volatility is rising; well below, it is fading.
- Learn what normal looks like. On EURUSD 1-hour candles in the Lab sample (2025-10-22 to 2026-10-23), half of the ATR(14) readings were below 10.8 pips and the highest 10% were above 16.3 pips. The 17 pips at marker 2 in the top chart sat in that top 10%. Past data, not a forecast.
- Size the position from the stop distance, never the other way round.
- Read the ATR on a closed candle. The current candle is still growing and keeps changing the value.
- Before you size a trade from the reading, check that no single news candle is dominating the average.
FAQ
Do I need a different ATR period for gold than for EURUSD?
Not necessarily. The period can stay the same; the reading will differ. On XAUUSD 1-hour candles (2025-10-22 to 2026-10-23) ATR(14) averaged 21.6 $, half the readings were below 18.7 $ and the highest 10% were above 31.2 $. Past data, not a forecast.
Should I read ATR on the daily chart to set intraday stops?
Usually not. A daily ATR measures a whole day's range, so a stop built from it is sized for a full day's movement, not the few hours you hold an intraday trade. The daily reading still works as a ceiling: an intraday stop close to a full day's ATR means one trade is planning for most of a day's movement.
Does the ATR period change how a trailing stop behaves?
Yes. With a short period the trailing distance swings after every large candle, so the stop can tighten suddenly once a news candle drops out of the window. With a long period the distance stays steadier, but it widens late after volatility rises, so for a while the stop sits closer than the new candles justify.